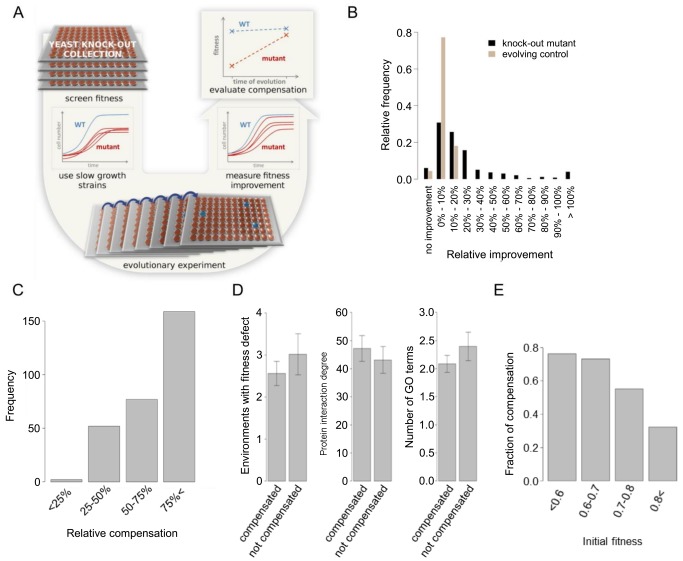
Figure 2. Compensation of fitness loss during laboratory evolution.
(A) Experimental scheme to estimate evolutionary compensation of gene defects. See text for details. (B) Distribution of relative fitness improvement (RFI) of the knock-out mutant strains and the evolving control lineages (Table S1), where RFI = (evolved fitness/initial fitness)−1. (C) Relative compensation (RC) of the compensated knock-out mutant strains (Table S1), where RC is the fraction of the initial fitness defect that was compensated for during laboratory evolution (see Materials and Methods). (D) Compensation does not depend on pleiotropy (Table S1). The bars indicate mean ± standard error, Wilcoxon rank sum test p-values for the three comparisons are: 0.71, 0.44, and 0.36, respectively. (E) Genotypes with lower initial fitness were more likely to be compensated for during laboratory evolution (Table S1). Lines were divided into groups by initial fitness, the fraction of compensated lines among all the lines in the group is shown as bars (chi-squared test for trend in proportions, p<10−13, number of lines in the groups from left to right: 38, 56, 201, 337).

