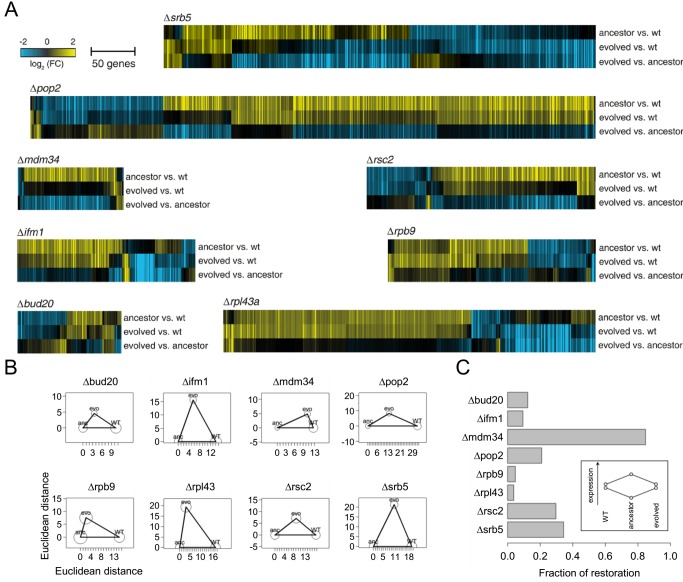
Figure 4. Comparisons of the transcriptome profiles of wild-type, ancestor, and evolved lines.
(A) Heatmaps of transcriptome profiles of deletion mutants Δrpl43a, Δpop2, Δmdm34, Δrsc2, Δifm1, Δrpb9, and Δbud20 and their corresponding evolved lines. For each deletion mutant, the fold-changes (FC) are shown for the ancestor strain versus the wild type, the evolved strain versus the wild type and the evolved strain versus the ancestor strain (Table S3). Color scales as indicated. Individual transcripts are depicted if they change significantly (FC>1.7, p<0.05) at least once in one of these comparisons. (B) The Euclidean distances of microarray profiles of the evolved evolutionary line from its ancestor and from wild type (WT) were calculated and normalized to the ancestor–wild type distance for each genotype. The distances of the points in the figure are proportional to the calculated profile distances. For each genotype triplet, distances were calculated on the basis of those genes that are differentially expressed in at least one of the pairwise comparisons. For each deletion strain, the edges of the triangle represent Euclidean distances of log2 mRNA expression fold-changes between the wild-type (WT), ancestor (anc), and evolved (evo) lines. To calculate these distances we used the average of four replicate expression measurements (two biological and two technical replicates). Circles around average values represent the Euclidean distance between the two biological replicates (calculated as the average based on the two technical replicates). For each genotype triplet, distances were calculated on the basis of those genes that are differentially expressed (FC>1.7, p<0.05) in at least one of the pairwise comparisons (Table S6). (C) Within the subset of genes that showed expression change upon gene deletion, the barplot shows the fraction of these genes that changed expression during evolution in the opposite direction (i.e., evolution towards restoration of wild-type expression level; see inset). With one major exception (lines disrupted in mdm34), only a small fraction of the expression changes were restored in the evolved lines (Table S6). The threshold for expression change was 1.7-fold-change and p<0.05, as in [62].

