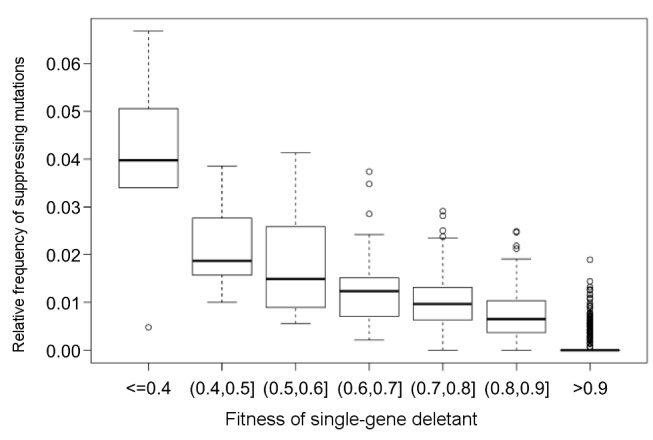
Figure 8. Strongly deleterious gene deletions can be suppressed by a large number of other null mutations according to a genome-wide genetic interaction study.

The plot shows the relationship between the fitness of a given single-gene deletion strain and the fraction of other genes across the genome whose deletion suppresses the fitness effect of this mutation (Table S9). Boxplots present the median and first and third quartiles, with whiskers showing either the maximum (minimum) value or 1.5 times the interquartile range of the data. Spearman correlation on raw data: rho = −0.69, p<10−16, n = 3880. We note that using the fraction of suppressive interactions among all genetic interactions displayed by a given gene yields a very similar result (rho = −0.69, p<10−16), indicating that the relationship is not simply due to the fact that slow-growing strains generally display especially large numbers of both positive and negative interactions [21]. Information on suppression genetic interactions and single-deletion fitness comes from a global genetic interaction map of yeast [21]. Suppression interactions were defined as in previously [70]. In brief, deletion of gene B suppresses deletion of gene A if their fitness values obey the following rules: FA<FB and FAB>FA+σA (where FA, FB, and FAB are the fitness measures of single deletants A, B, and the double deletant AB, respectively, and σA is the standard deviation of FA). One important caveat is that as this simple analysis considers null mutations only, the results should be considered preliminary.
