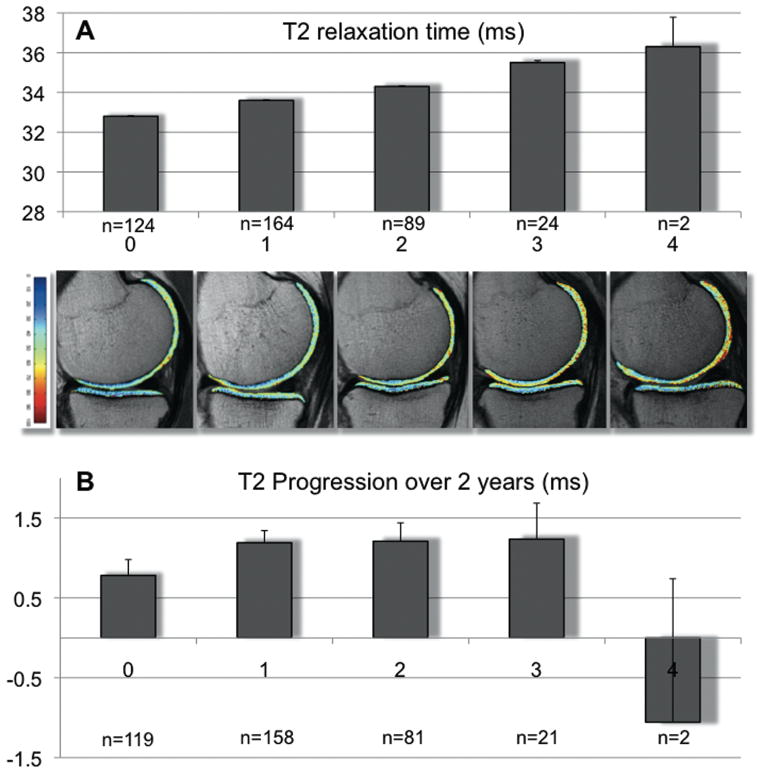
Figure 2.
A: Adjusted mean baseline global T2 relaxation times (ms; ±SEM) for subgroups with increasing numbers of metabolic risk factors (0–4), adjusted for other OA risk factors and a continuous measure of BMI. T2 increased stepwise with increasing number of metabolic risk factors from 32.8±0.2ms for none to 36.3±2.0ms for four risk factors. For the number of metabolic risk factors present, (0–4), P<0.001 without adjustment for BMI and P=0.032 with adjustment for BMI. Other OA risk factors are age, gender, Herbeden’s nodes, family history of joint replacement, previous knee surgery and previous knee injury. Underneath representative cartilage T2 color maps overlaid on the first-echo images of the MSME sequence of each group. Blue color indicates low, red color high cartilage T2. Subjects without any metabolic risk factor showed lower T2 than subjects with metabolic risk factors in an increasing manner.
B: Progression of T2 relaxation times (%; ±SEM) over two years for subgroups with increasing numbers of metabolic risk factors. Analyses as described for A. For the number of metabolic risk factors present, (0–4), P<0.071 without adjustment for BMI and P=0.191 with adjustment for BMI.

