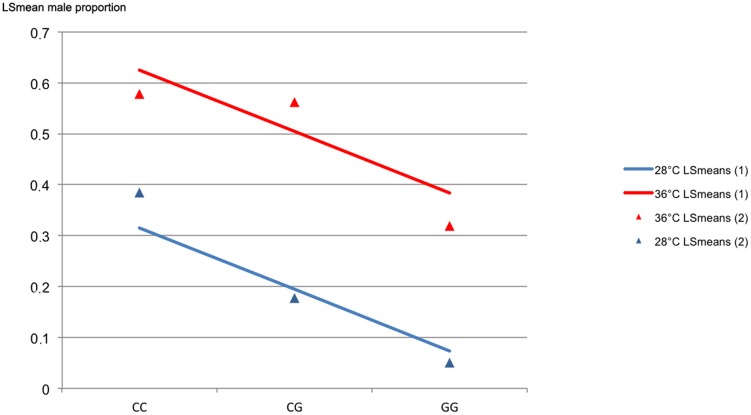
Figure 3. Relationship between male proportion and genotype at amh variant ss831884014 in Nile tilapia, reared at 28°C or 36°C from 10 to 20 days post fertilisation.
Linear least-square regression of the genotypic values (LSmean male proportion) for genotypes C/C, G/C, and G/G at locus ss831884014 of the amh gene (Scaffold GL831234.1). The genotypic values were derived from the regression models by either excluding the interaction between SNP and treatment (LSmeans 1: red and blue line) or by including the interaction between SNP and treatment (LSmeans 2: red and blue triangles) as effect class. Numbers of individuals per genotype were 26/79/20 and 114/144/47 for genotypes C/C, G/C, and G/G, for the control group (28°C) and the group reared at high temperature (36°C), respectively.

