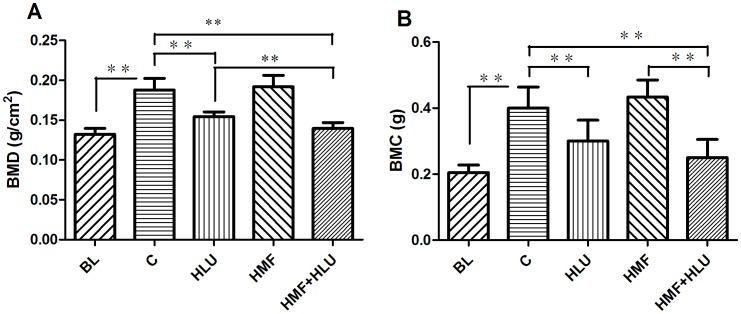
Figure 4. Changes in femoral BMD and BMC measured by DEXA.
BL: The baseline group. Rats were executed to get basal data on day 0 of the experiment. C: Rats were raised in a wooden box with a normal GMF for 28 days; HLU: Rats were suspended, unloaded with −30° downward head tilting, and raised in a wooden box; HMF: Rats were raised normally in a GMF-shielded room; HMF+HLU: HLU rats were raised in a GMF-shielded room. BMD: bone mineral density; BMC: bone mineral content; **P<0.01.

