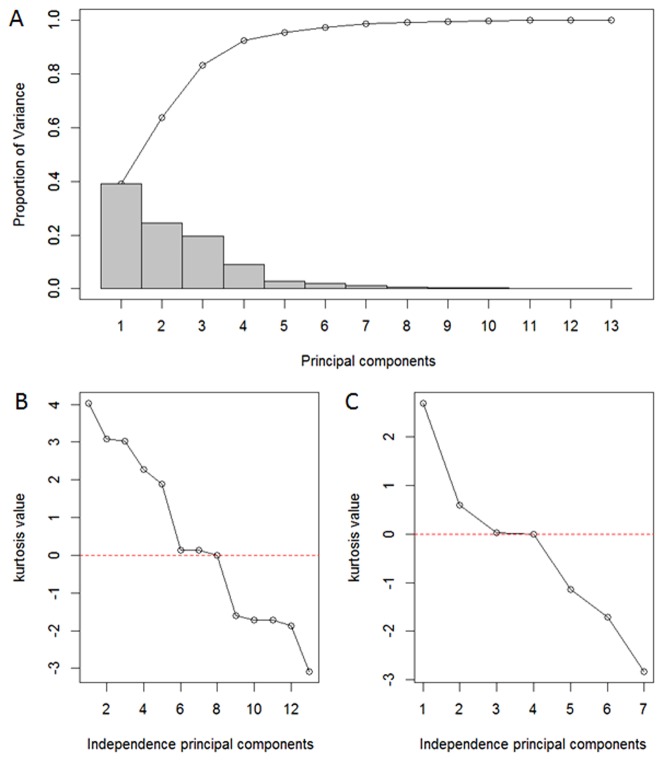
Figure 3. Component contributions of PCA and IPCA.
(A) Pareto chart of principal components (PCs) in PCA indicated the first three PCs in Phase I explained 80.99% variances. (B) Kurtosis measurements of all extracted independence principal components (IPCs) in IPCA with Phase I data. The kurtosis of IPC8 was close to zero, so the first 7 components of IPCA were used to choose exact numbers of IPCs. (C) Kurtosis measurements of the first 7 IPCs showed that the kurtosis of IPC3 was close to zero, and the first 2 components were sufficient with IPCA.

