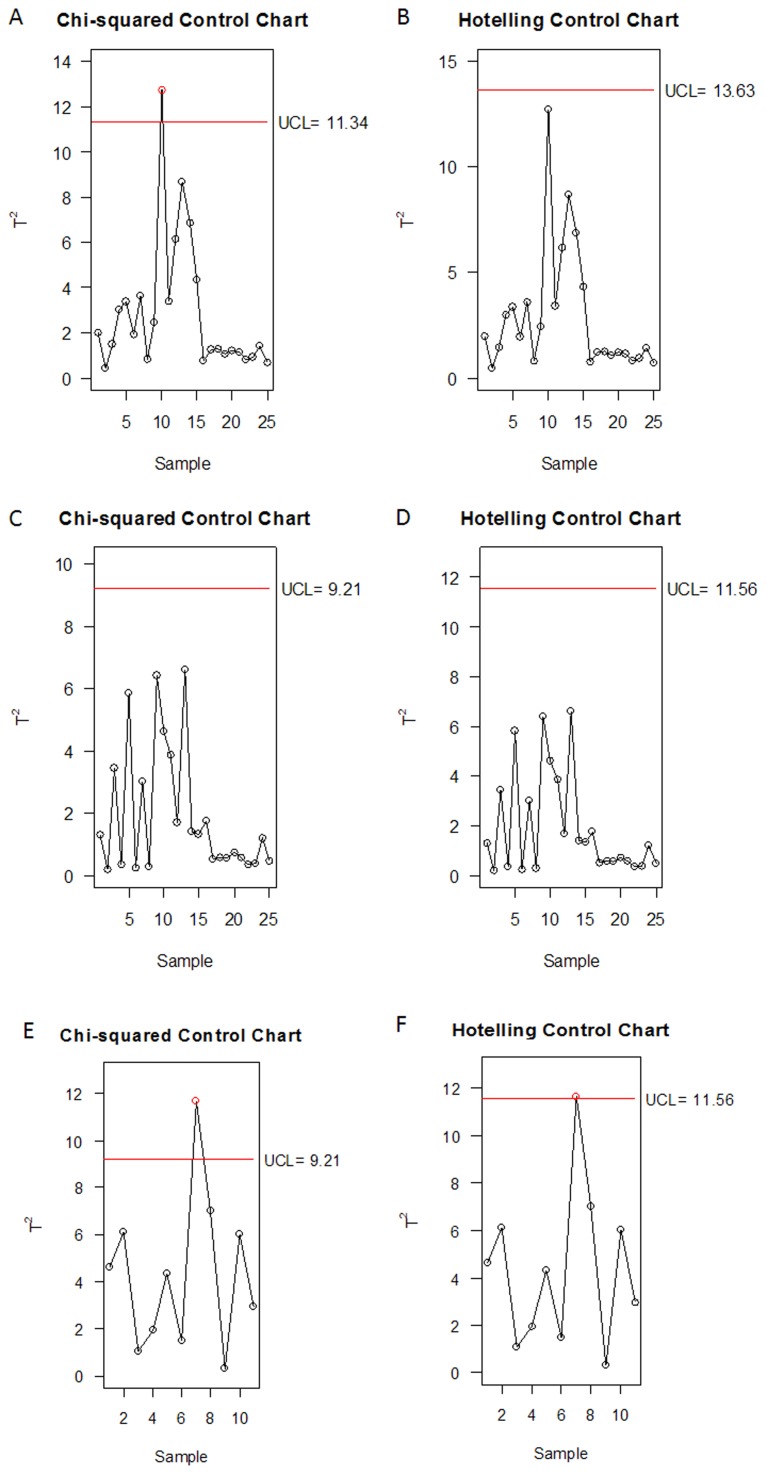
Figure 4. Multivariate quality control charts.
The χ2 and Hotelling control charts of the first three principle components (PCs) in Phase I (A and B), and the first two independence principle components (IPCs) in Phase I (C and D) and Phase II (E and F). Red solid lines represented the upper control limits (UCL) of control charts with 99% confidence region.

