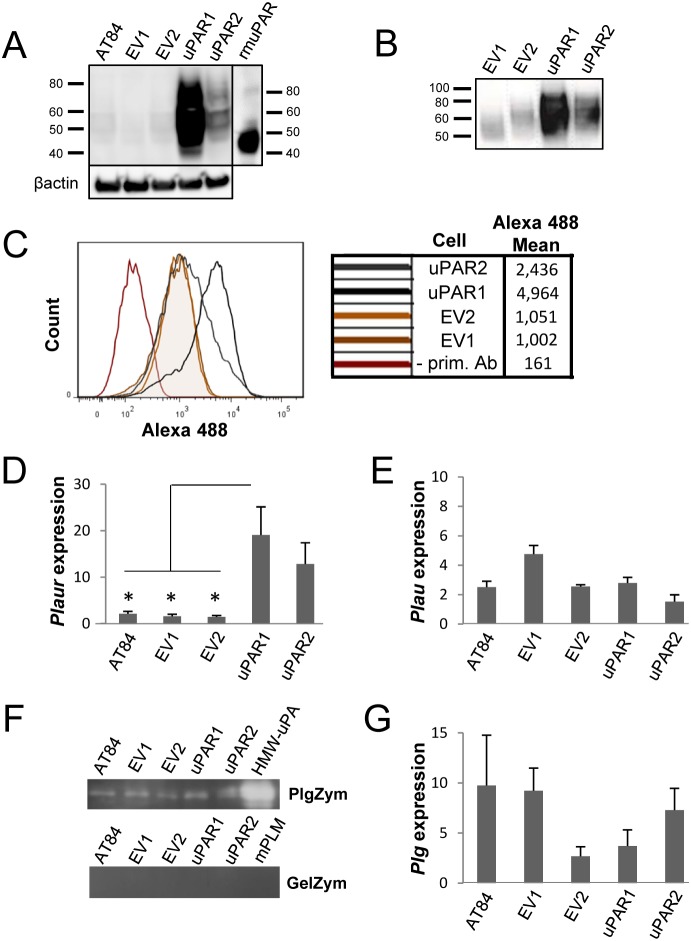
Figure 1. Expression of murine Plaur in AT84 cells.
In vitro characterization of AT84 cells stably transfected with either empty vector (EV) or a vector containing cDNA encoding murine uPAR (Plaur). A: Western blot analysis of whole cell lysates using a polyclonal anti-murine uPAR antibody (AF534). A total of 7.5 ng of recombinant murine uPAR (rmuPAR) was loaded as a positive control. Re-probing for β-actin was used as a loading control. B: Western blot analysis of cellular membrane fractions using a polyclonal anti-murine uPAR antibody (AF534). Total protein was measured per sample and 53.5 µg of protein was loaded per lane. A and B: Images were cropped, as no additional bands were detectable. C: FACS analysis of non-permeabilized cells using a polyclonal anti-murine uPAR antibody (AF534). Alexa Fluor 488 anti-goat secondary antibody (A11055) was used as the secondary antibody. The quantified mean Alexa 488 fluorescence signal per cell line is presented in the panel to the right. D and E: Relative Plaur mRNA (uPAR) (D) or Plau mRNA (uPA) (E) expression levels as analysed using RT-qPCR. All expression levels were normalized to the expression of the reference genes Trfc and β-actin. Error bars represent the standard error of mean (+SEM) and N = 3. One-way ANOVA; *p<0.05. F: Plasminogen-gelatin (upper panel) and gelatin (lower panel) zymography analysis of conditioned medium of cells cultured for 24 hours in SFM. HMW-uPA and mPLM (mouse plasmin) were loaded as positive controls. The images were cropped to size. G: Relative Plasminogen mRNA (Plg) expression levels as analysed using RT-qPCR. Error bars represent standard error of mean (+SEM) and N = 3.

