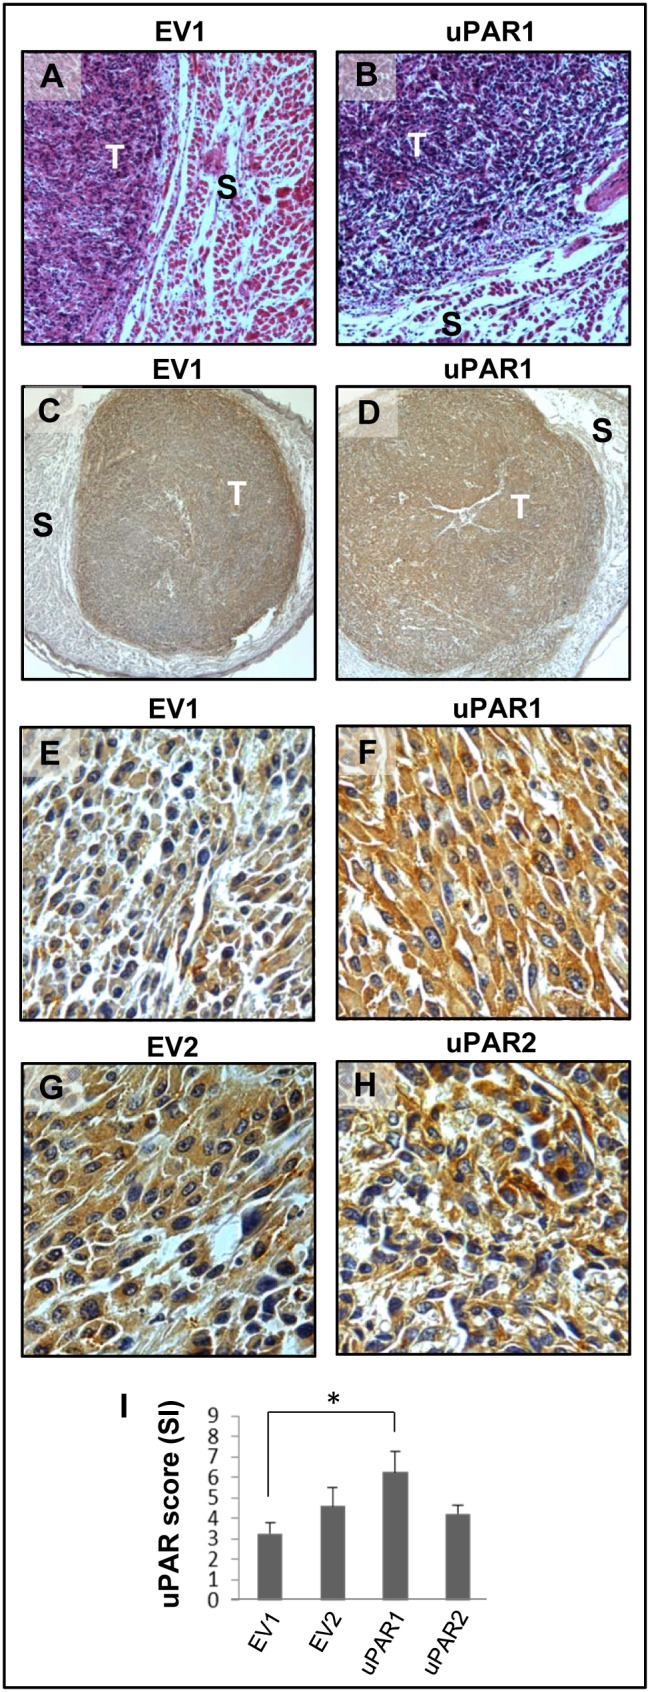
Figure 2. Tumour microenvironment induced uPAR protein expression in tongue tumours.

Tumour growth pattern and uPAR protein levels in tongue tumours generated from the EV1, EV2, uPAR1 and uPAR2 cells. A–B: Representative images depicting the tumour growth pattern at the tumour-stroma interface in hematoxylin/eosin stained EV1 (A) and uPAR1 (B) tumours. Images were recorded at 10x magnification. C–D: Representative images depicting the IHC uPAR staining of the EV1 (C) or uPAR1 tumours (D). Images were recorded at 4x magnification. E–H: The images show high power magnification (20x magnifications) of the EV1 (E), uPAR1 (F), EV2 (G) and uPAR2 (H) tumours IHC stained for uPAR protein. Positive uPAR staining is seen as brown colour, and counterstaining was done with haematoxylin. I: The average staining index (SI) of the uPAR staining in the tumours. Maximum obtainable score is 9. The error bars shows the +SEM. N = number of tumours; EV1, N = 8/10; EV2, N = 5/10; uPAR1, N = 4/10; uPAR2 N = 9/10. One-way ANOVA; **p<0.01, *p<0.05. T = Tumours, S = Stroma.
