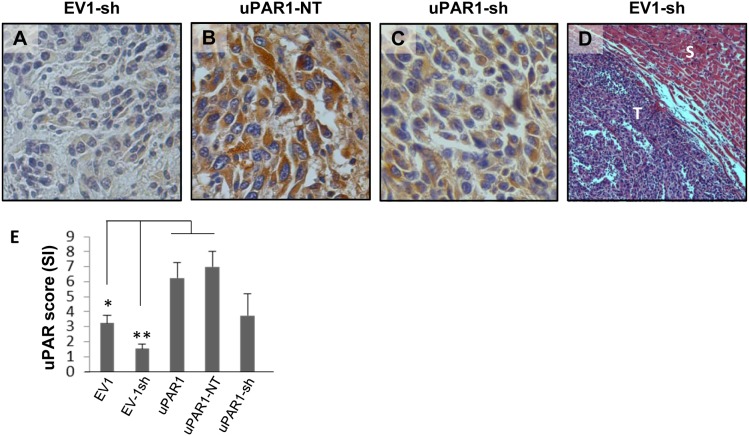
Figure 4. In vivo tongue tumours of EV1 and uPAR1 knock-down cells.
IHC uPAR staining and growth pattern of tongue tumours generated from the EV1 and uPAR1 cells containing either shRNA targeting uPAR (EV1-sh and uPAR1-sh), or non-targeting shRNA (uPAR1-NT). A–C: IHC uPAR staining of EV1-sh (A), uPAR1-NT (B) and uPAR1-sh (C) tumours, respectively. Images were recorded at 20x magnifications. D: Representative image depicting the tumour growth pattern at the tumour-stroma interface in hematoxylin/eosin stained EV1-sh. E: The average SI of the uPAR staining in the tumours, with the maximum obtainable score of 9. The error bars shows the +SEM. N = number of tumours; EV1, N = 8/10; EV1-sh, N = 11/16; uPAR1, N = 4/10; uPAR1-NT, N = 3/8; uPAR1-sh, N = 4/16. One-way ANOVA; **p<0.01, *p<0.05. T = Tumour, S = Stroma.

