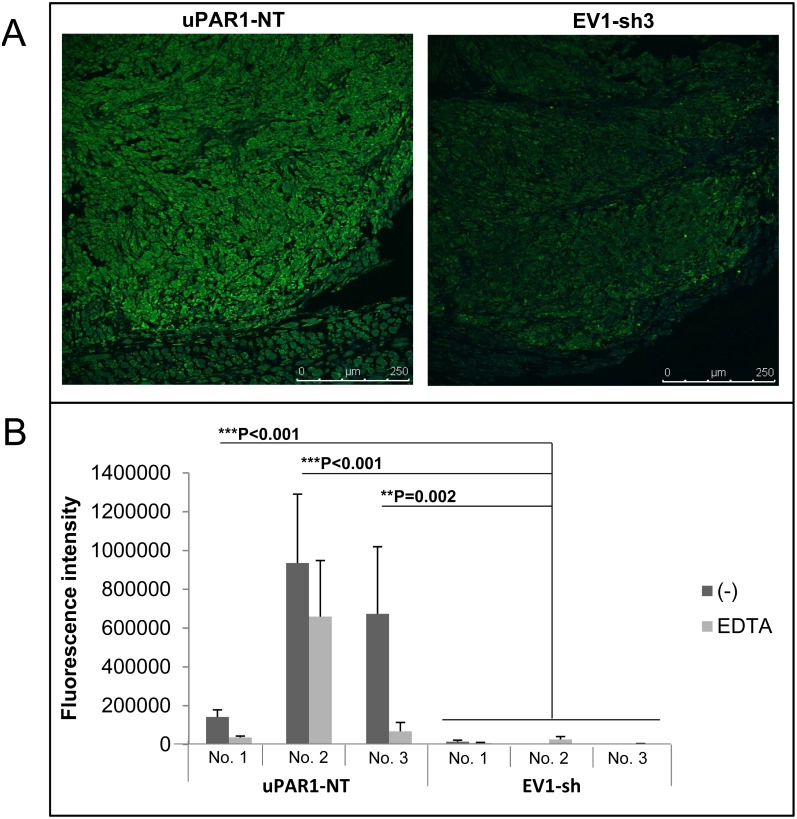
Figure 7. Gelatinolytic activity is enhanced in tumours expressing high levels of uPAR.
ZBF-fixed tongue tumours were sectioned and analysed for the presence of gelatinolytic activity using DQ-gelatin in situ zymography. Gelatinolytic activity is seen as green fluorescence. A: Representative confocal images of tongue tumours generated from the uPAR1-NT cells (left panel) and EV1-sh3 cells (right panel). B: Quantification of fluorescence intensity (analysed using Volocity as described in materials and methods) for a minimum of 5 images per tumour, presented as mean values. Three individual uPAR1-NT tumours (No.1–No.3) and three EV1-sh tumours (No.1–No.3) were analysed. Error bars shows the standard deviation (+SD) between the five images analysed. Dark grey bars represents gelatinolytic activity in the tumour sections, light grey bars represents gelatinolytic activity in tumour sections treated with the metalloproteinase inhibitor EDTA. Mann-Whitney rank sum test; ***p<0.001, **p<0.01, *p<0.05.

