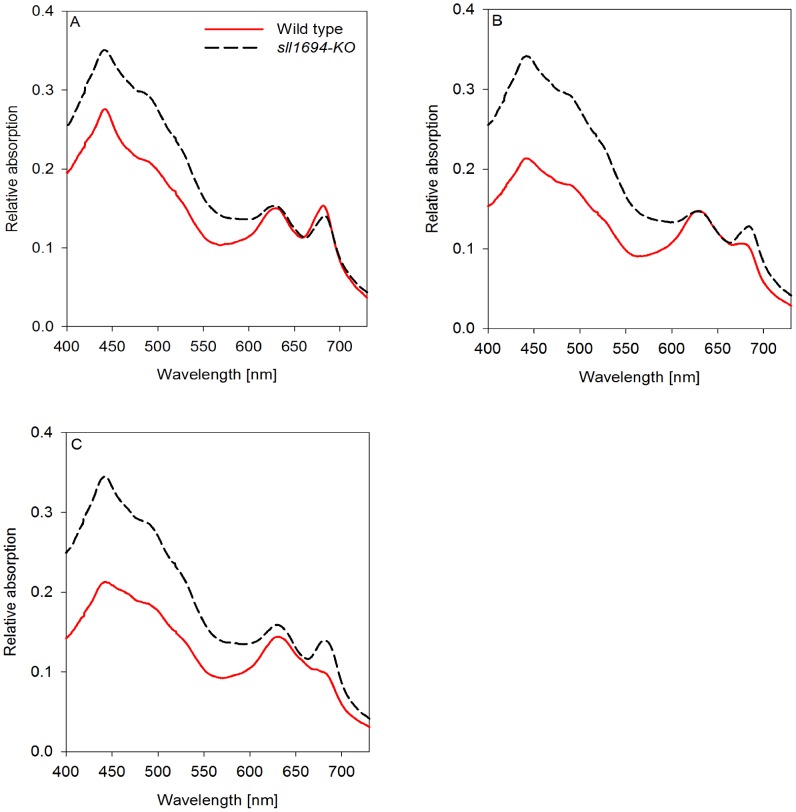
Figure 5. Absorption spectra of photoautotrophically grown plate cultures.
Both wild type and Δsll1694 cells grown on agar-solidified BG-11 with ammonium iron(III) citrate (A), iron(III) oxide (B), or goethite (C) as the exclusive iron source. Samples were standardized to an OD800 of 0.3. Traces were baseline subtracted at 800 nm after acquisition. One data set is shown, which is representative of three separate experiments. The average standard error between triplicates was calculated. Wild type SE: ±1.8×10⁻³ (A), ±1.3×10⁻³ (B), ±3.9×10⁻³ (C); Δsll1694 SE: ±4.0×10⁻³ (A), ±4.3×10⁻³ (B), ±3.0×10⁻³ (C). For non-baseline subtracted absorption spectra for plate grown cultures see Figure S5 in File S1).

