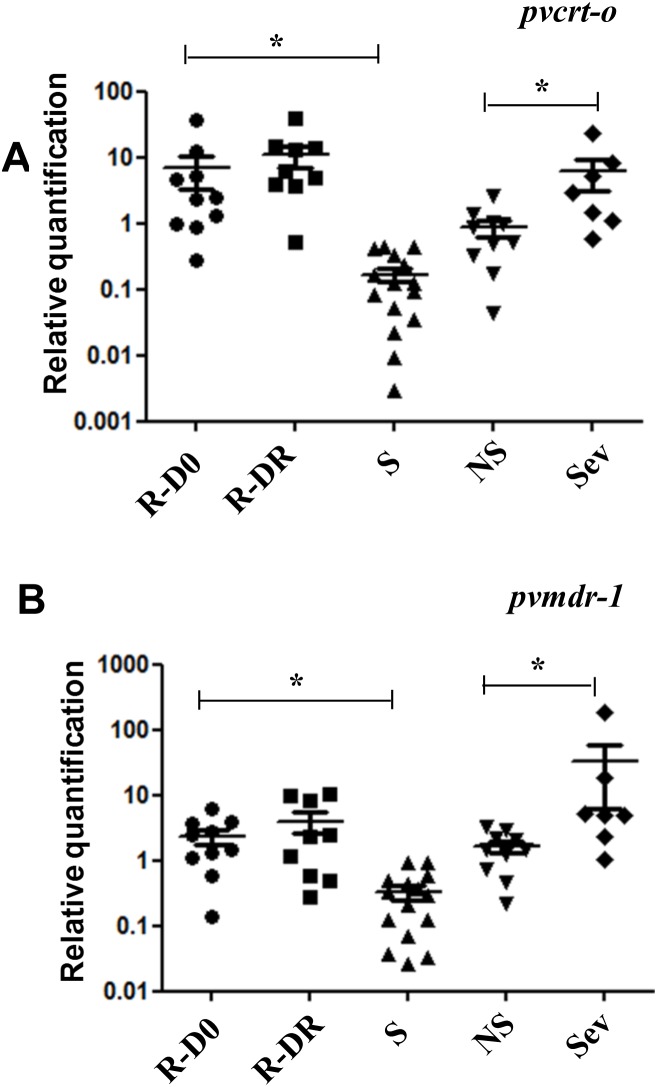
Figure 2. Expression gene levels of pvcrt-o and pvmdr-1 in all the groups.
Relative quantification of pvcrt-o (A) and pvmdr1 (B) transcript levels in total RNA obtained from parasites from severe patients with chloroquine-resistant P. vivax, patients susceptible to CQ, severe patients and patients without severity symptoms. Chloroquine-resistant P. vivax parasites (R). Chloroquine-susceptible P. vivax parasites at D0 (S). Severe cases (Sev). Non-severe cases (NS). *p<0.05.

