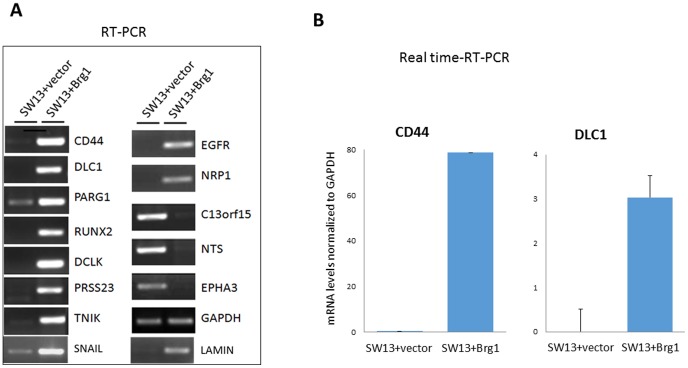
Figure 4. Validation of the Microarray data by RT-PCR.
(A) Florescence intensity of RT-PCR products as a measure of mRNA expression confirming microarray data. Upon reintroduction of BRG1 into SW13 cells, regulation of gene expression differs from those cells without BRG1. GAPDH was loaded as a control. (B) Real time RT-PCR quantitation of CD44 and DLC1 mRNA levels.

