
Figure 1. Genome-wide association study for additive and dominance effects on number of teats in pigs.
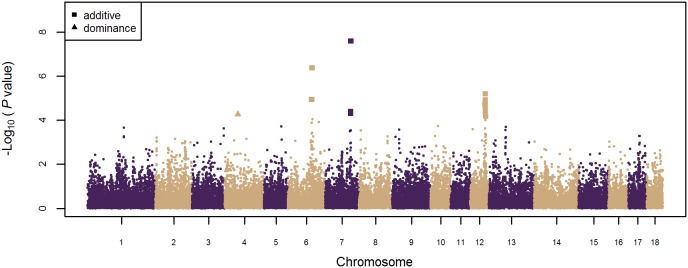
On the y-axis is the −log10 (P-values) of single-SNP association with number of teats in pigs. On the x-axis is the physical position of the SNPs across the 18 autosomes. SNPs associated (false discovery rate ≤0.10) with number of teats having additive and dominance effects are represented by squares and triangles, respectively.