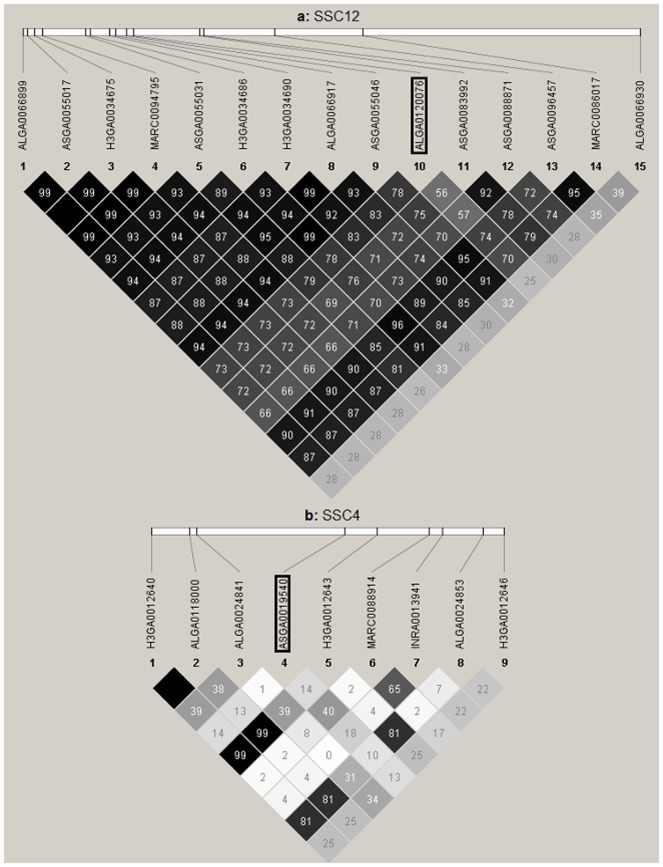
Figure 2. Difference in linkage disequilibrium (LD) between two distinct QTL regions.
(a) LD (r2) between the significant SNPs of the QTL region on Sus Scrofa chromosome (SSC) 12; the most significant SNP in this region is surrounded by a square. (b) LD between the SNPs located 0.2 Mb downstream and upstream of the only significant SNP (surrounded by a square) of the QTL region on SSC4. The numbers inside the diamonds are the LD measurements (r2) on a scale of 0 to 100%.

