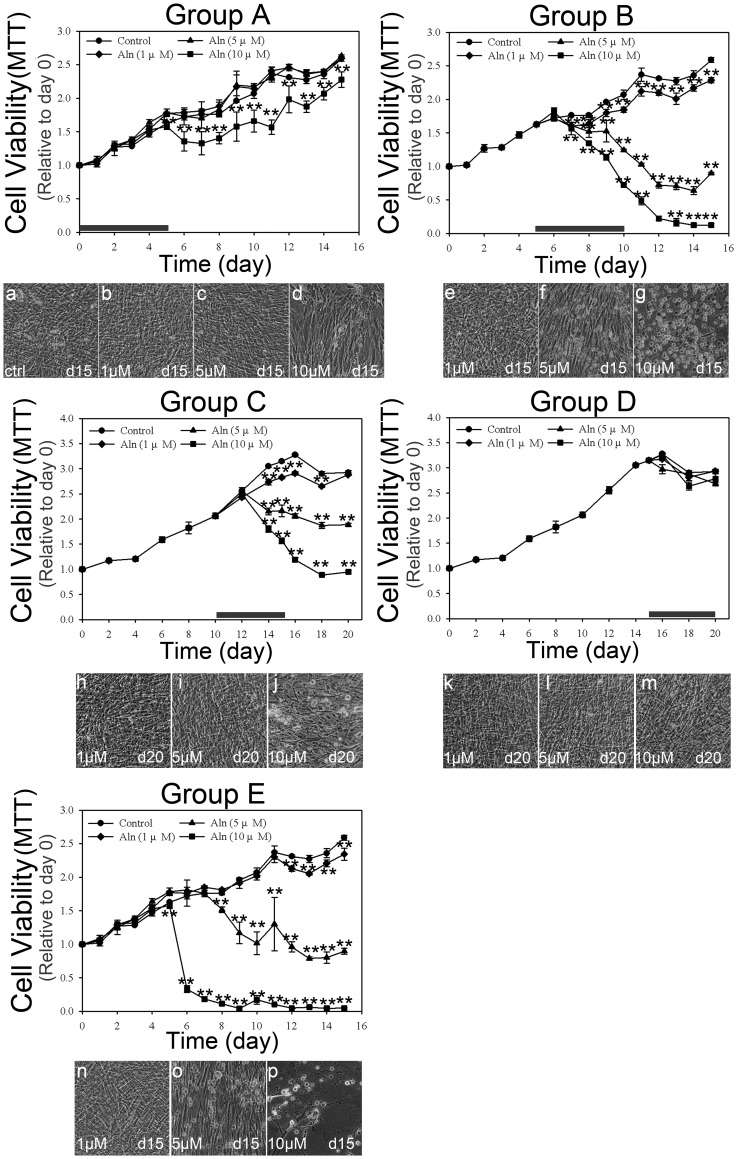
Figure 3. The cell viabilities of hBMSC after various Aln treatment strategies.
The cell viabilities of cultures with various Aln treatment strategies were measured by MTT assays, and the cell morphology after various Aln doses for the indicated time are shown. The duration of Aln treatment is indicated by a bold bar. (Group A: a–d; Group B: e–g; Group C: h–j; Group D: k–m; Group E: n–p). **p<0.01 (n = 4).

