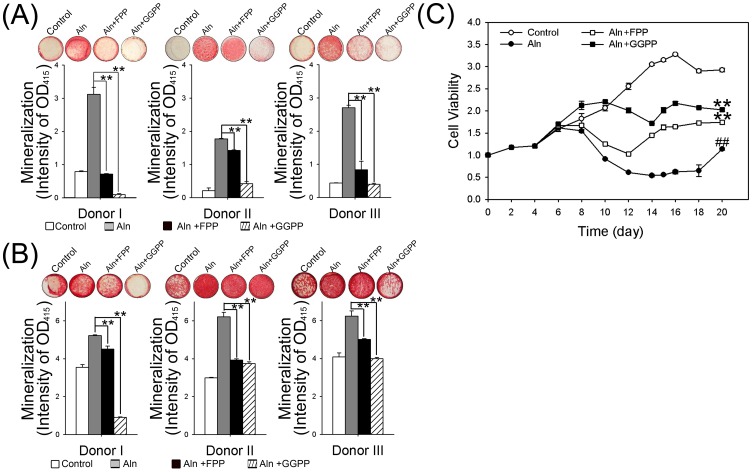
Figure 4. The reversal effects of FPP or GGPP on mineralization and cell viability of Aln-treated hBMSC with group B.
The mineralization effects and cell viabilities of Aln-treated hBMSCs with group B were determined after additional treatment with FPP or GGPP. The ARS staining was performed at day15 (A) and day20 (B). The mineralization levels are shown as photographs and the quantified data shown as bar graph compared to 5 µM Aln-treated group. **p<0.01, n = 5, compare with 5 µM Aln treatment. (C) The cell viabilities of hBMSCs treated with control, 5 µM Aln only, 5 µM Aln with 10 µM FPP or 5 µM Aln with 10 µM GGPP were measured by MTT assays and normalized to day 0. **p<0.01, n = 4, compare with 5 µM Aln treatment; ## p<0.01, n = 4, compare to the control.

