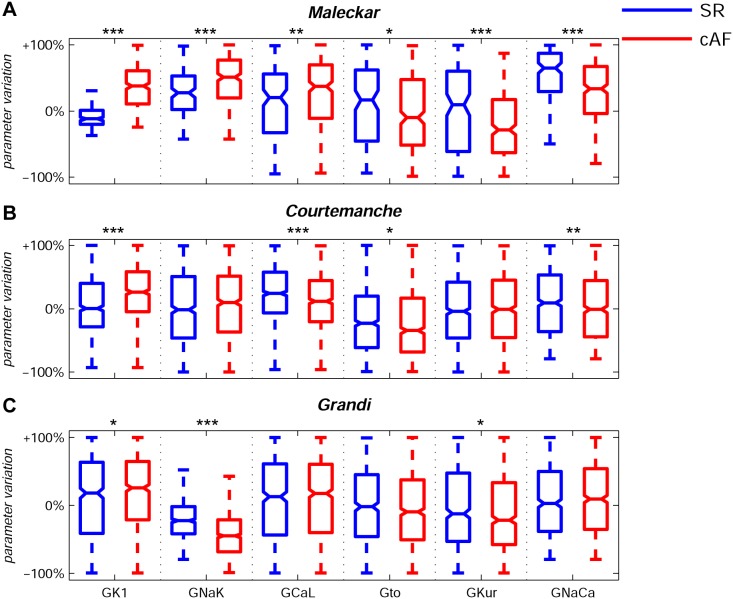
Figure 1. Ranges of variability of ionic conductances in the human atrial AP model populations.
Median values and ranges of variability of ionic conductances GK1, GNaK, GCaL, Gto, GKur and GNaCa in the experimentally-calibrated populations of human atrial AP models, sampled within a ±100% range of their original values in the Maleckar (A), Courtemanche (B) and Grandi (C) human atria AP models in SR (blue) and cAF (red). Each boxplot represents the range covered by the ionic conductances: the edges of the box are the 1st and 3rd quartiles, the whiskers extend to the most extreme datapoints, the estimated median physiological value is the central horizontal line and the notch around the median is the 5% significance level. (Mann-Whitney U test: *p<0.05; **p<0.01; ***p<0.001).

