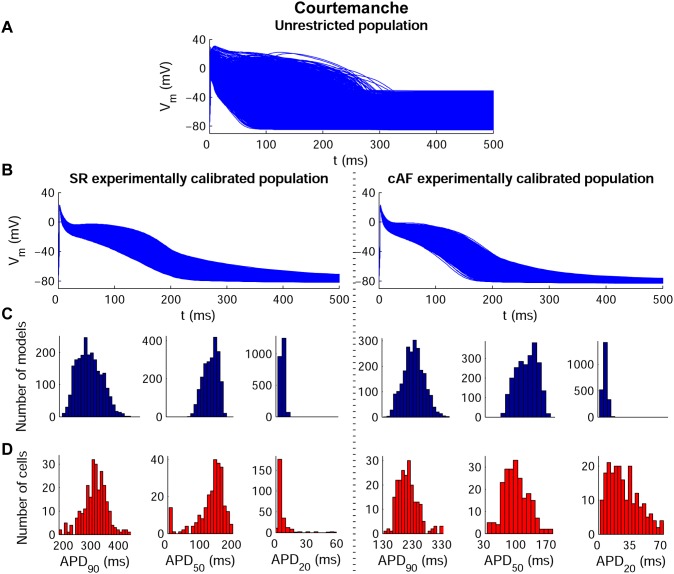
Figure 2. Experimentally-calibrated human AP model populations for SR and cAF based on the Courtemanche model.
Initial unrestricted ±100% sampled population (A), experimentally calibrated ±30% sampled populations (B) and histograms corresponding to APD90, APD50 and APD20 distributions in both the calibrated model populations (C) and the experimental measurements (D). Histogram bar widths are 10 ms for both APD90 and APD50, and 4 ms for APD20.

