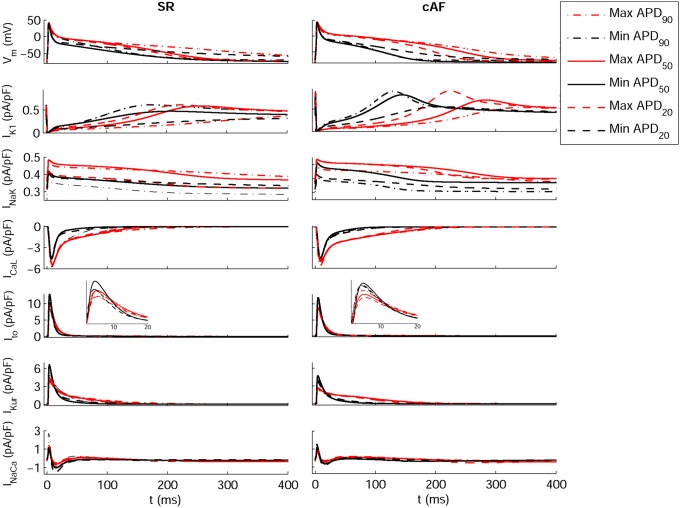
Figure 4. Transmembrane potential and ionic current traces in SR and cAF for the Maleckar model-based populations.
Traces for models displaying maximum APD90 (red dash-dotted lines), minimum APD90 (black dash-dotted lines), maximum APD50 (red thin solid lines), minimum APD50 (black thin solid lines), maximum APD20 (red dashed lines) and minimum APD20 (black dashed lines). Insets provide detailed views of peak Ito current.

