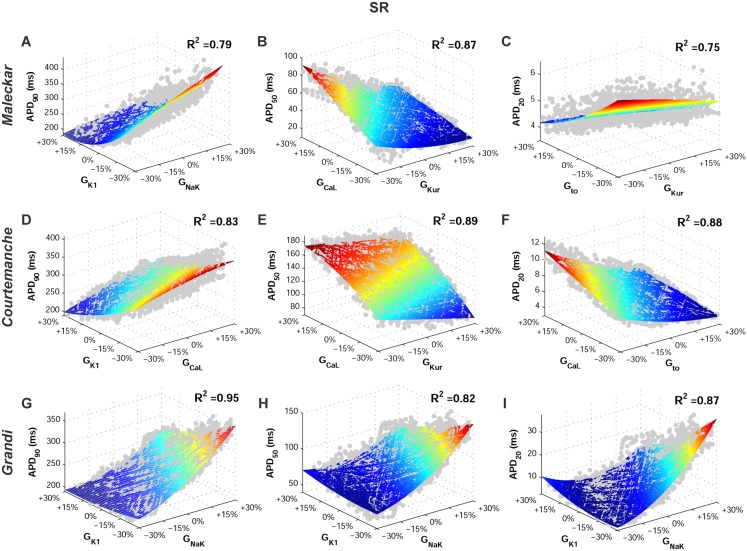
Figure 5. Ionic conductances determining inter-subject variability in human atrial repolarization in the SR AP model populations at 1 Hz.
Regression surfaces for APD90, APD50 and APD20 are presented with respect to the two most significant ionic factors determining their variability, using populations based on the Maleckar (A–C), Courtemanche (D–F), and Grandi (G–I) models. Regression surfaces are color coded according to APD magnitudes, whereas each big dot denotes the value for one model in the calibrated populations.

