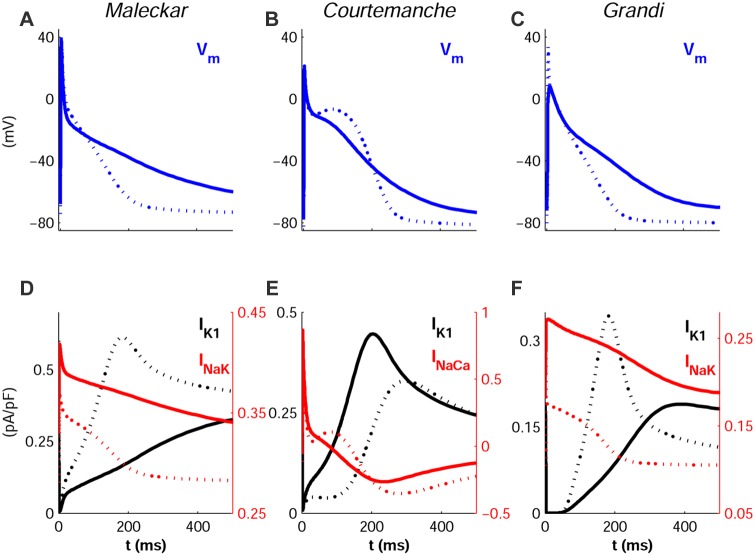
Figure 8. Inter-subject variability in human atrial AP triangulation.
The most and least triangular APs in each population are shown (solid and dotted lines, respectively), obtained with the Maleckar (A), Courtemanche (B) and Grandi (C) models in SR. Corresponding time-course of ionic mechanisms of AP triangulation are shown: IK1 and INaK (D and F), IK1 and INaCa (E).

