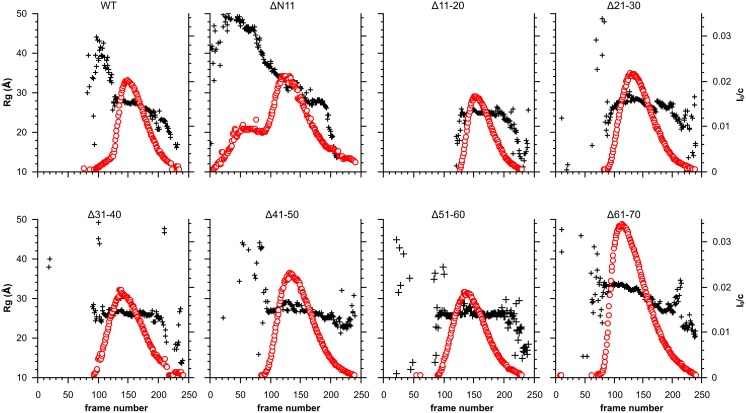
Figure 5. SAXS analysis of the HSPB6 10-residue deletion mutants.
For each construct, 250 frames were collected during elution from a Shodex KW-404F column. The radius of gyration (Rg) and forward scattering (I0) were calculated at each measured point using buffer subtracted scattering curves that had been averaged by a ten-frame moving average algorithm to improve the signal-to-noise. The forward scattering values are normalized by dividing the values by the concentration of the sample at the peak maximum. The Rg is plotted as a black cross for each construct and scaled on the left axis, the I0 is shown as a red circle and scaled on the right axis.

