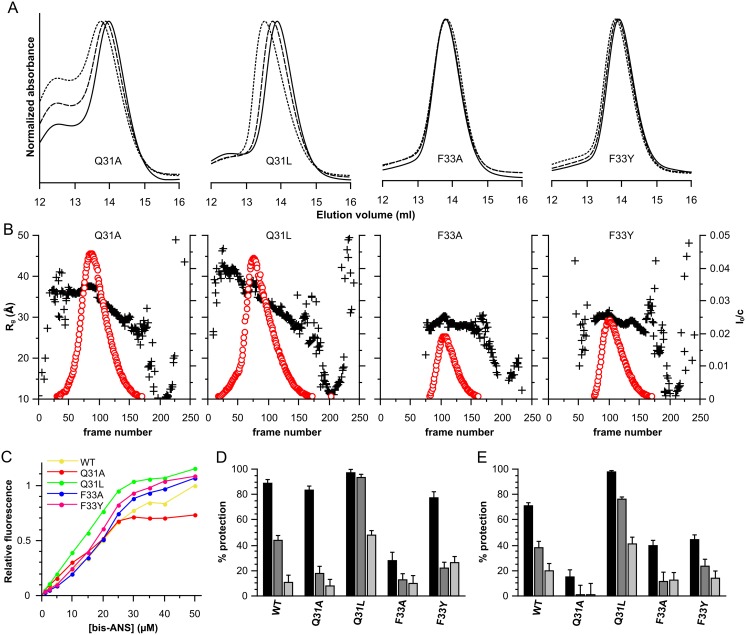
Figure 8. Characterization of the HSPB6 point mutations.
(A) Size-exclusion chromatography profiles. 100 µl of protein was loaded onto a Superdex 200 10/300 GL column at different concentrations. 2.5 mg/ml is depicted as a full line, 5 mg/ml as a dashed line and 10 mg/ml as a dotted line. The absorbance was normalized to the maximum absorbance for each curve. (B) SAXS analysis of the HSPB6 mutants. For each construct, 250 frames were collected during elution from a Shodex KW-404F column. The radius of gyration (Rg) and forward scattering (I0) were calculated at each measured point using buffer subtracted scattering curves that had been averaged by a ten-frame moving average algorithm to improve the signal-to-noise. The forward scattering values are normalized by dividing the values by the concentration of the sample at the peak maximum. The Rg is plotted as a black cross for each construct and scaled on the left axis, the I0 is shown as a red circle and scaled on the right axis. (C) Bis-ANS titration curves, 2.5 µM protein was mixed with increasing concentrations of bis-ANS and fluorescence intensities were measured at 490 nm using and excitation wavelength of 390 nm. Wild type B6 is shown in yellow, Q31A in red, Q31L in green, F33A in blue and F33Y in pink. (D) Chaperone-like activity of wild-type HSPB6 and its mutants against aggregating insulin, the monomer mass molar ratios tested were 1∶0.2 (black), 1∶0.1 (dark gray) and 1∶0.05 (light gray). (E) Chaperone-like activity of wild type B6 and its mutants against aggregating yADH. The ratios used are 1∶2 (black), 1∶1 (dark gray) and 1∶0.5 (light gray).

