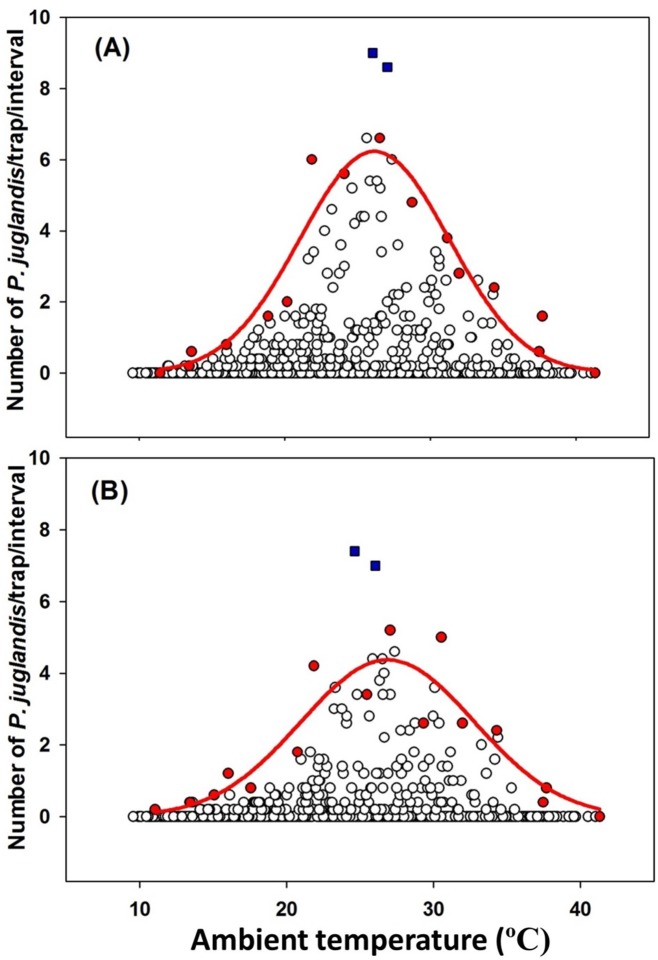
Figure 4. The Gaussian relationship (Y = α×exp(−(X−X0)2/2b)) between Pityophthorus juglandis catches and temperature (°C).
(A) Female: N = 855, F = 63.38, P<0.001, α = 6.23, b = 5.11, X 0 = 26.16, adj. R 2 = 0.89; (B) Male: N = 855, F = 28.87, P<0.001, α = 4.37, b = 5.89, X 0 = 26.87, adj. R 2 = 0.79. Blue □: Outliers; Red ◯: Data points used to fit curves. These points were the greatest values of trap catches from each of the temperature classes [28].

