
Figure 6.
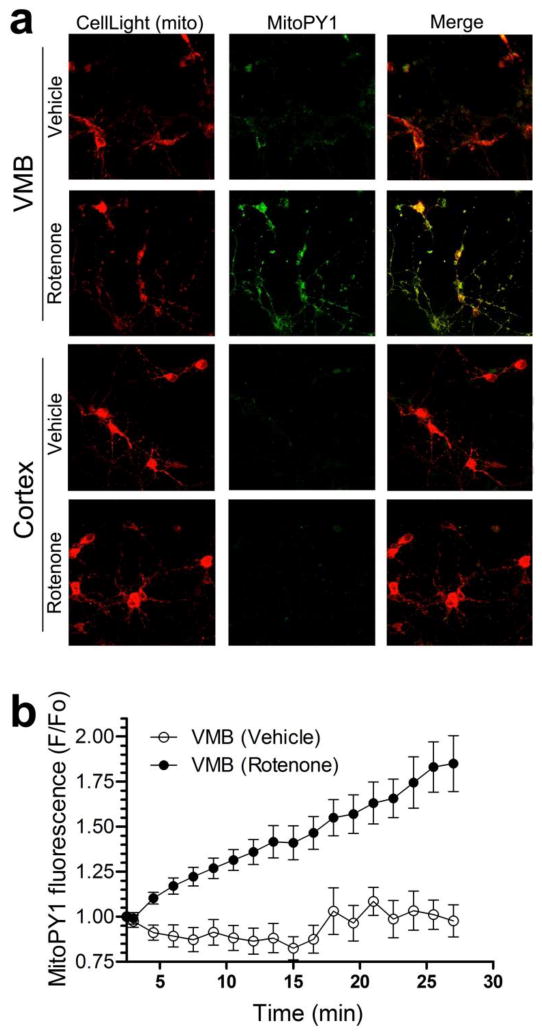
Increased levels of mitochondrial H2O2 in rat primary VMB but not cortical neurons after rotenone treatment in vitro. (a) Representative fluorescence images of mitochondria (red) and the mitochondrial H2O2 indicator, MitoPY1 (green), in live primary VMB and cortical neurons. Administration of 10 nM rotenone to VMB neurons generated bright MitoPY1 fluorescence that co-localized with mitochondria. Few cortical neurons showed bright MitoPY1 fluorescence after rotenone administration. Similarly, few VMB or cortical neurons contained bright MitoPY1 fluorescence after vehicle administration. (b) Kinetic studies of mitochondrial H2O2 accumulation in VMB neurons showed increased MitoPY1 fluorescence within 5 minutes of rotenone administration (black circles) relative to vehicle (white circles). MitoPY1 fluorescence continued to increase for at least 27 minutes after 10 nM rotenone exposure. Data are presented as mean ± SEM.