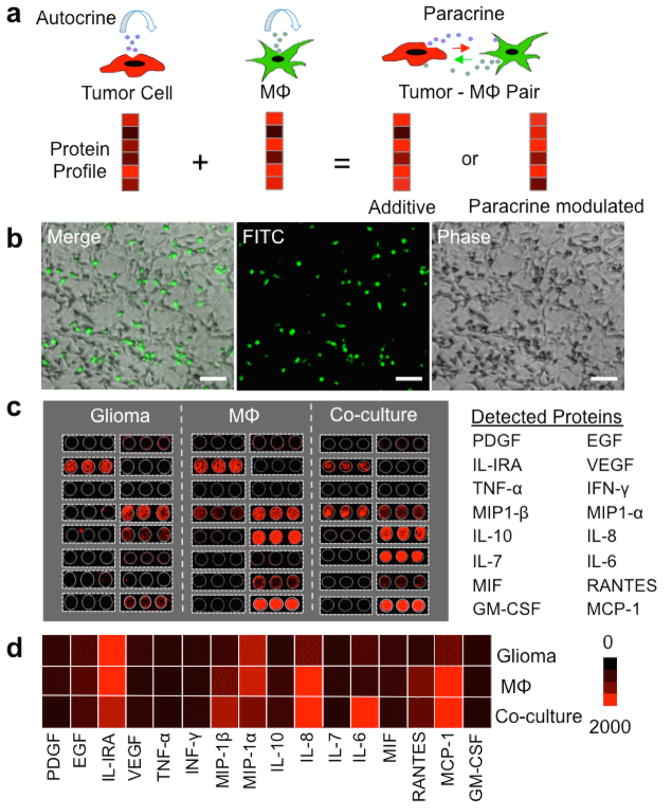
Figure 1. Population level assay of glioma-macrophage paracrine signaling.
(a) Schematic depiction of tumor-macrophage paracrine signaling changing protein profiles at the single cell level. (b) Optical images showing co-culture of human glioma cells (U87) and macrophages (U937-derived) in a conventional microwell platform. Macrophages were pre-stained with green cell tracker dye CMFDA and visualized using the FITC fluorescence channel. Scale bar: 100 μm. (c) Scanned fluorescent images of the pin-spotted antibody microarrays used to measure protein secretion. Cell culture media were collected after 24 hours of incubation of glioma, macrophage (Mϕ) and glioma-macrophage co-culture. Microarrays were read out using APC dye-labeled streptavidin at 635 nm (Red). (d) Heat map showing 24-hour protein secretion profiles of glioma, macrophage (Mϕ) and glioma-macrophage cultures at population level.

