
Figure 3.
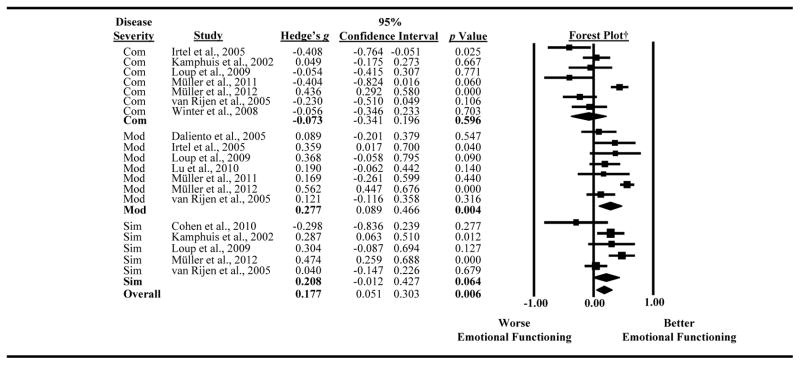
Forest plot depicting results by lesion severity.
†The boxes on the forest plot vary in size depending on the weight of the study in the meta-analysis. The diamond represents the pooled effect size.
Abbreviations: Com, complex; Mod, moderate; Sim, simple.