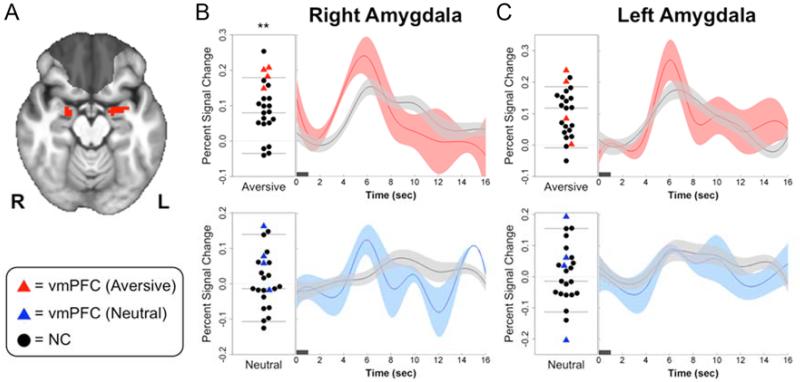
Figure 3.
Greater right amygdala responses to aversive pictures in vmPFC lesion patients. (a) Task-derived right and left amygdala ROIs (red) used to extract mean percent signal change (PSC) estimates for group comparisons. vmPFC lesion overlap shaded in gray for reference. (b) Left, plots of right amygdala PSC for individual NC (black circles) and vmPFC (red and blue triangles) subjects in response to aversive pictures (top) and neutral pictures (bottom). Horizontal lines represent the mean and 95% confidence intervals of PSC values in the NC group. Right, mean timeseries of right amygdala PSC in response to aversive and neutral pictures for vmPFC (red, blue) and NC (black) subjects (width of shaded area corresponds to ±1 s.e.m.). (c) Plot and mean timeseries of PSC extracted from the left amygdala ROI. Dark horizontal bars on timeseries plots indicate picture duration (1 s). **P<0.01

