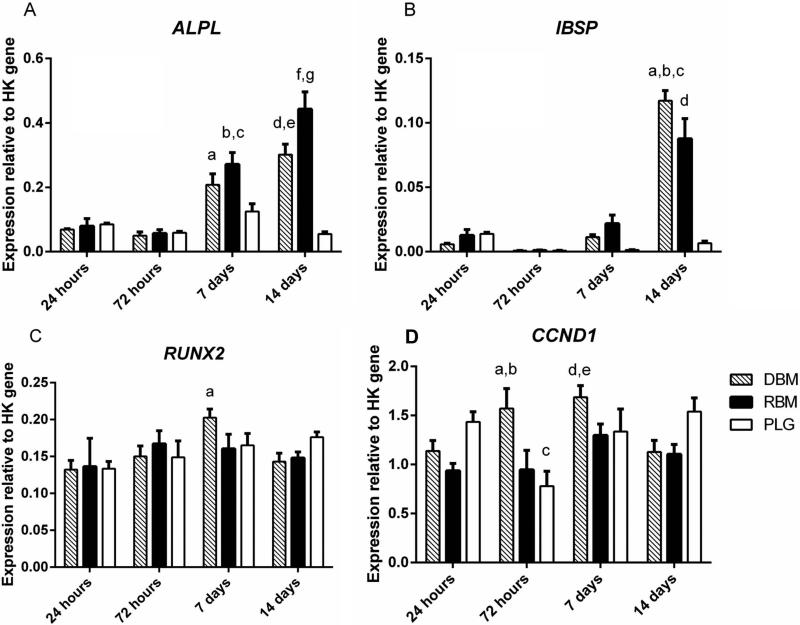
Figure 6.
Quantitative polymerase chain reaction analysis of hMSC gene expression. DBM, RBM, and PLG scaffolds seeded with MSCs and collected after 24 hours, 72 hours, 14 days, or 21 days.
ALP: ap<0.01 compared to DBM at 24/72 hours; bp<0.001 compared to RBM at 24/72 hours; cp<0.01 compared to PLG at 7 days; dp<0.001 compared to DBM at 24/72 hours; ep<0.001 compared to PLG at 14 days; fp<0.001 compared to RBM at 24/72 hours, 14 days; gp<0.001 compared to DBM/PLG at 14 days
IBSP: ap<0.001 compared to DBM at 24/72 hours, 7days; bp<0.001 compared to PLG at 14 days; cp<0.05 compared to RBM at 14 days; dp<0.001 compared to PLG at 14 days
Runx2: ap<0.05 compared to DBM at 24
CyclinD1: ap<0.05 compared to RBM at 72 hours; bp<0.01 compared to PLG at 72 hours; cp<0.05 compared to PLG at 24 hours; dp<0.05 compared to RBM at 24/72 hours; ep<0.01 compared to PLG at 72 hours

