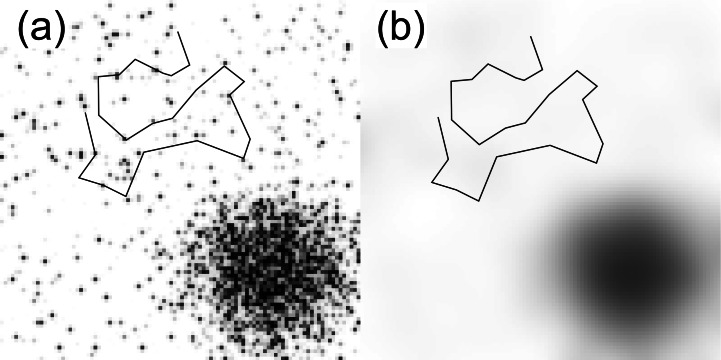
Figure 1. Example of how spatial scale can affect preference.
(A) Hypothetical store density map of a city and surrounding suburbs, where dark grid squares represent high store density, overlaid with the movement path of a suburban family. Local movements indicate a preference for stores, but this preference does not extend to the city, where shopping opportunities are abundant. (B) Store density map after smoothing with a 21-pixel Gaussian filter. Now, it is apparent that the family selects against store density at a larger scale, even though it selects for store density at a smaller scale.

