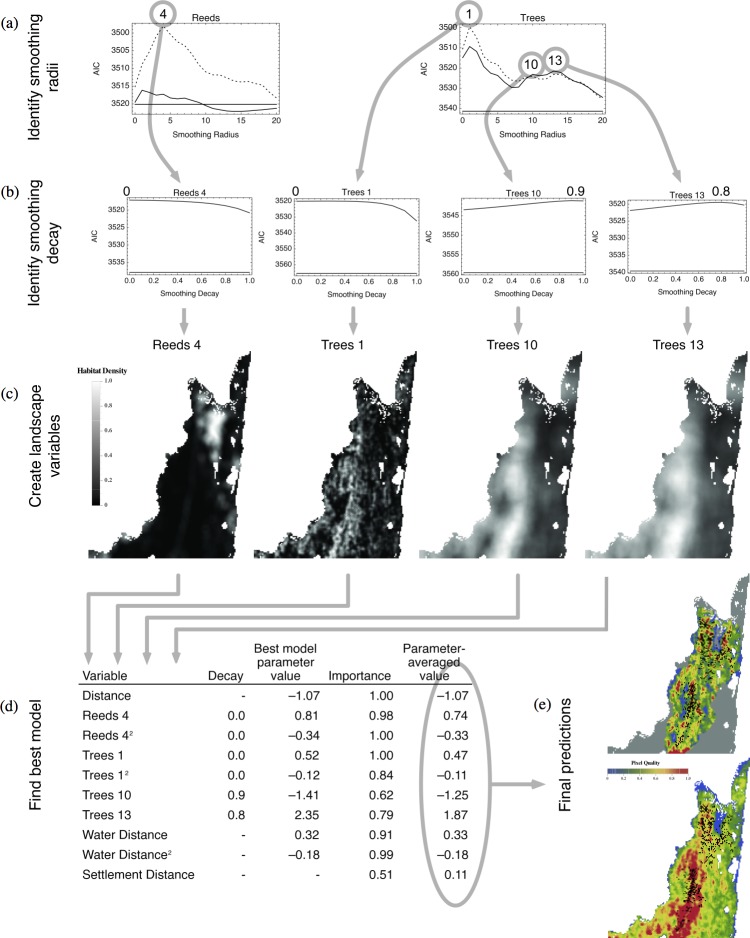
Figure 5. Process of model selection with multiple scales.
(A) Identify smoothing radii. The smoothing radii for the variables reeds and tree cover were optimized separately for three models: distance from current location only (flat solid line), distance and habitat variable (jagged solid line), and distance with both the linear and quadratic habitat variables (dashed line). Each of the peaks of model fit at the various radii is indicated. (B) Identify smoothing decay. The decay was optimized for each of the optimal radii in (A). The optimal decay for each radius is indicated. (C) Create landscape variables. Maps were created for each of the variables at the optimal radius and decay. Each map is a composite of the linear and quadratic values. (D) Find best model. The overall model choice uses the distance from current location, each of the selected variables at the optimal radius and decay, distance to water, and distance to human settlement (if applicable) as input parameters. The best model was chosen as the combination of model parameters with the lowest AIC score; in this case, the score was 3,472.33. The importance of the parameter is measured from the weights of the models in which it appears, and the parameter-averaged value is the value of the parameter averaged across all models. (E) Final predictions. The local relative quality map was created using the parameter-averaged values for all of the model parameters and applied to the 10-pixel radius of local movement choices for each start point (top). The map was overlaid with the endpoint of each movement to assess elephant choice. The landscape-wide relative quality map was created using the parameter-averaged values for all of the model parameters and applied to the entire landscape (bottom). The map was overlaid with the endpoint of each movement to assess elephant choice.

