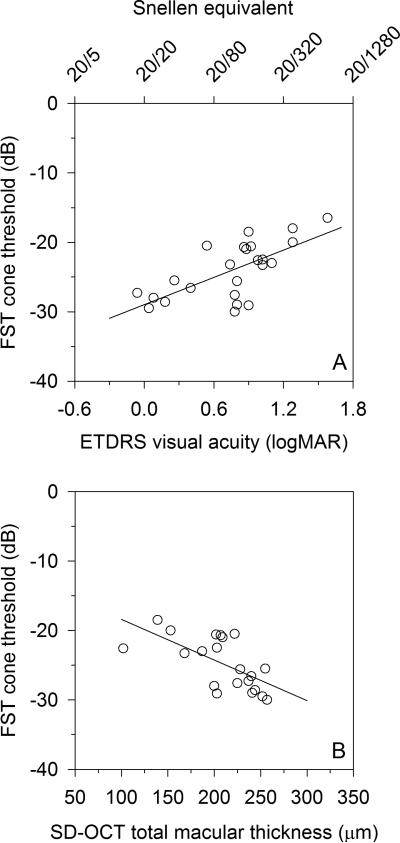
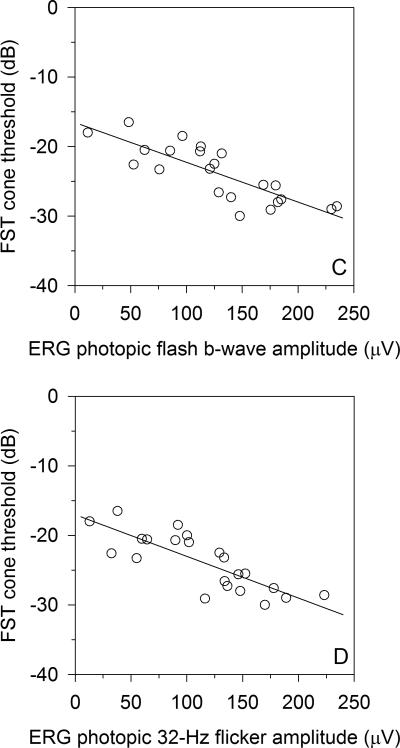
Figure 2.
For Stargardt disease patients, FST cone plateau to a red stimulus (cone threshold) correlated well with A) logMAR visual acuity (r=0.67, P<0.001), and B) SD-OCT total macular thickness (r=-0.65, P=0.002). Stronger FST cone threshold correlations are found with C) light adapted single-flash ERG (r=-0.78, P<0.001), and D) light adapted 32-Hz flicker ERG (r=-0.78, P<0.001). For the FST zero dB = 0.1 cd-s/m2.


