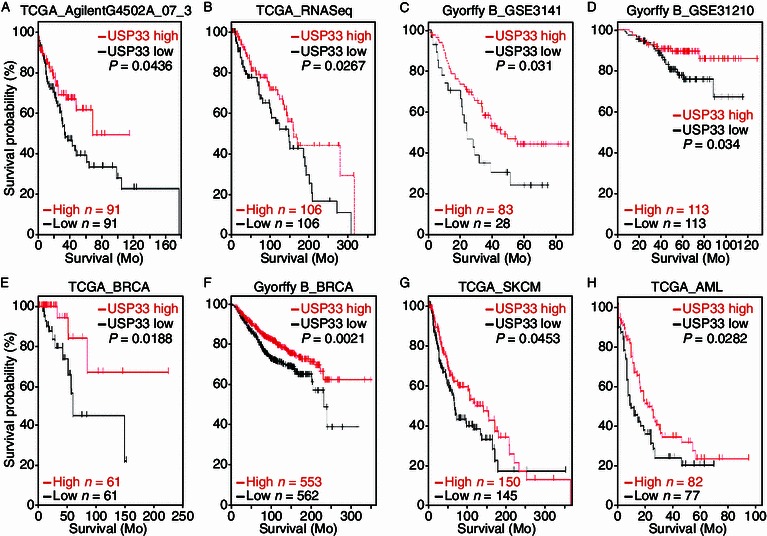
Figure 3.

Low USP33 expression correlates with poor patient survival in multiple cancer datasets. Kaplan-Meier curves showing the overall survival analysis in patients with high and low expression of USP33 from eight public tumor datasets: (A) TCGA lung data set (AgilentG4502A_07_3 array, n = 91 for USP33 low, n = 91 for USP33 high; P = 0.0436 with log-rank analysis); (B) TCGA lung data set (IlluminaHiSeq_RNASeqV2 array, n = 106 for USP33 low, n = 106 for USP33 high; P = 0.0267 with log-rank analysis); (C) Lung cancer dataset (GSE3141) was analyzed by KM plotter. The data were dichotomized at the lower quantile value into high and low expressing groups (n = 28 for USP33 low, n = 83 for USP33 high; P = 0.031 with log-rank analysis); (D) Lung cancer dataset (GSE31210) was analyzed by KM plotter. The data were dichotomized at the median value into high and low expressing groups (n = 113 for USP33 low, n = 113 for USP33 high; P = 0.034 with log-rank analysis). (E) TCGA breast carcinoma data set (n = 61 for USP33 low, n = 61 for USP33 high; P = 0.0188 with log-rank analysis); (F) Breast cancer data were analyzed by KM plotter. The data were dichotomized at the median value into high and low expressing groups (n = 562 for USP33 low, n = 553 for USP33 high; P = 0.0021 with log-rank analysis); (G) TCGA skin cutaneous melanoma data set (n = 145 for USP33 low, n = 150 for USP33 high; P = 0.0453 with log-rank analysis); (H) TCGA acute myeloid leukemia data set (n = 77 for USP33 low, n = 82 for USP33 high; P = 0.0282 with log-rank analysis)
