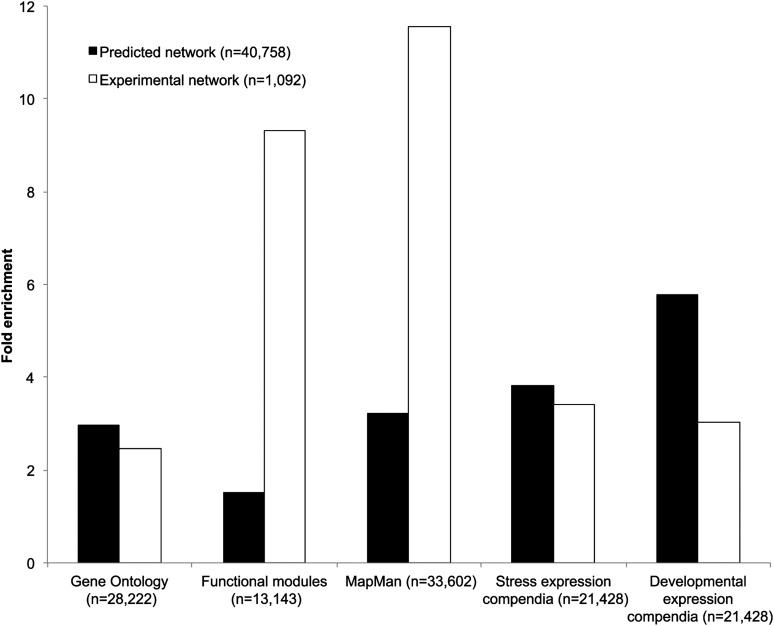
Figure 4.
Evaluation of the Biological Relevance of the Predicted Network Using Different Biological Metrics Assessing Functional and Expression Coherence.
GO annotations, MapMan annotations, and functional modules together with a stress and developmental expression compendium were used to evaluate the biological relevance of the predicted GRN. A comparison of fold enrichment is depicted between the predicted network (black bars) and the experimental network (white bars). All reported fold enrichments are significant (P value < 0.05). Numbers in parentheses report the number of regulatory interactions in the two networks and the number of genes having functional or expression information, respectively.

