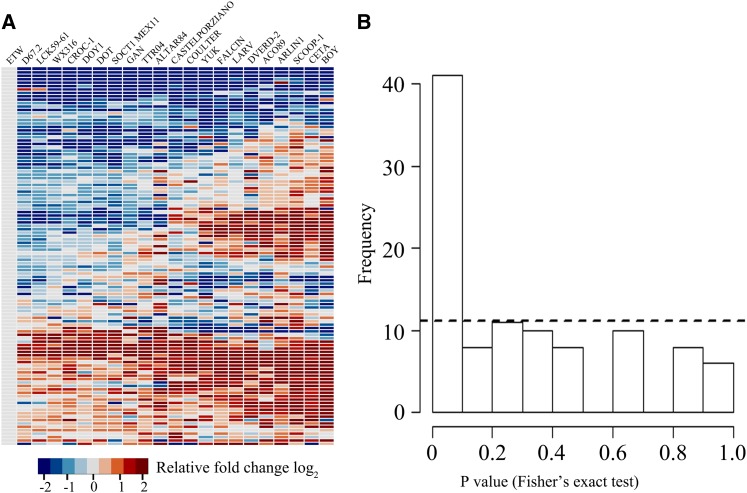
Figure 4.
Expression Level Differences between ETW and 21 durum Wheat Cultivars of Diverse Origins Based on qRT-PCR Assay in the Seedling Leaf Tissue.
(A) Heat maps of expression of 111 genes (Supplemental Data Set 3) in ETW relative to each of 21 durum wheat cultivars of diverse origins based on qRT-PCR assay with three biological replicates. The color key is indicated.
(B) A Fisher’s exact test was conducted to test whether the gene expression level difference between ETW and each durum cultivar versus that of normal gene expression divergence among the diverse durum cultivars was equal.

