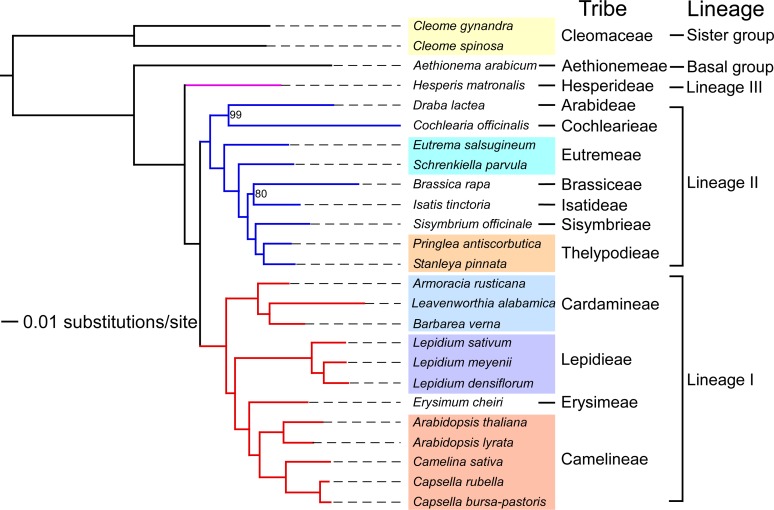
Figure 1.
Molecular Phylogeny of Brassicaceae Species.
A maximum likelihood tree produced from a supermatrix constructed based on 213 orthologous sequences. Clade support values near nodes represent bootstrap proportions in percentages. All unmarked nodes have absolute support. Branch lengths represent estimated nucleotide substitutions per site. Information about tribal and lineage assignments is given on the right.
[See online article for color version of this figure.]

