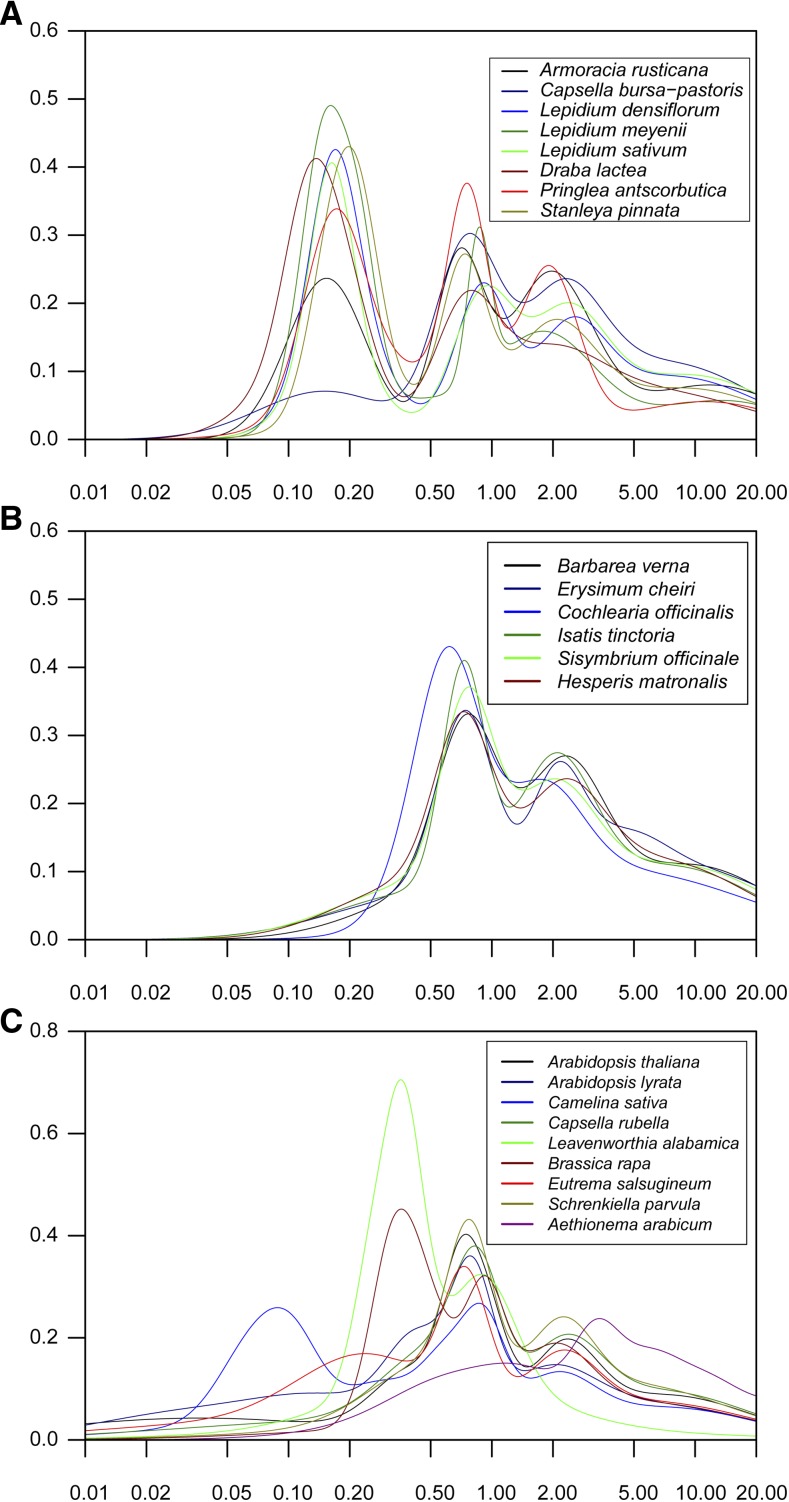
Figure 2.
Age Distribution of Duplicated Genes in Brassicaceae Species.
Gaussian mixture models fitted to frequency distributions of Ks (synonymous substitution) values obtained by comparing pairs of paralogous genes from Brassicaceae species are shown. Histograms of frequency distributions of Ks values for all 23 species are presented in Supplemental Figure 1. The x and y axes are ln(Ks) and the expected frequency in intervals of 0.1 of ln(Ks), respectively.
(A) Crucifer species that have undergone a recent neo/mesopolyploidy event.
(B) Crucifer species without a recent neo/mesopolyploidy event.
(C) Completely sequenced Brassicaceae species.

