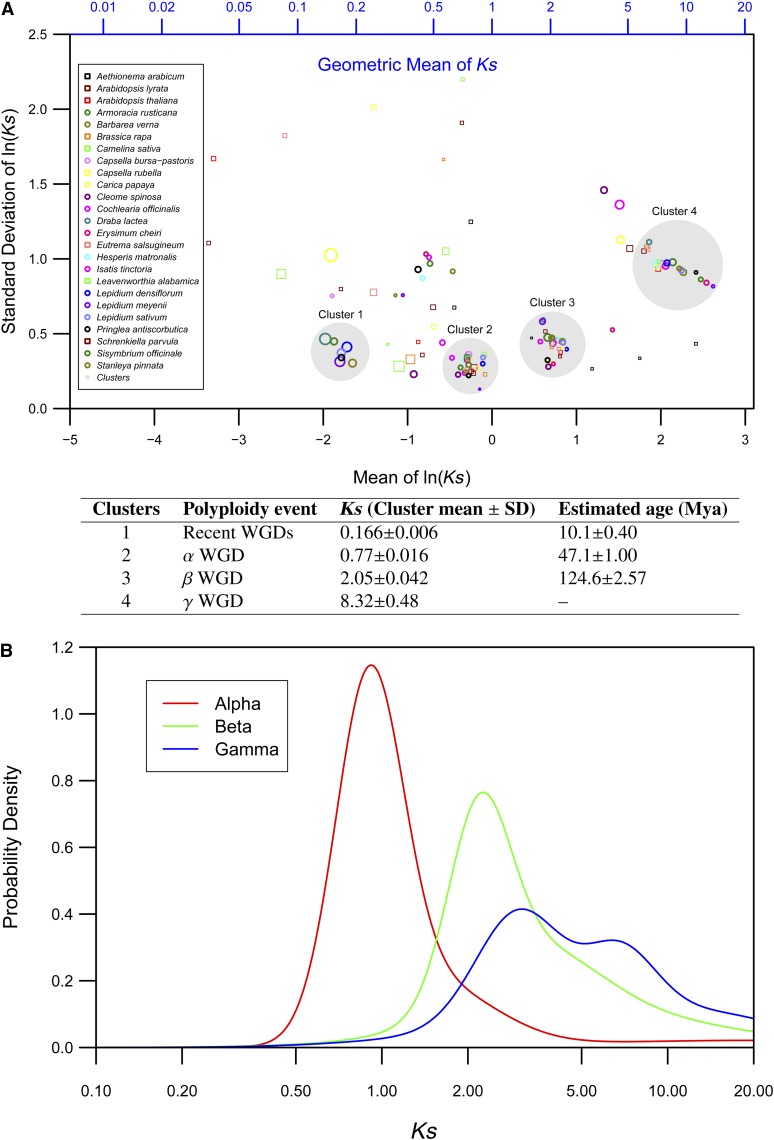
Figure 3.
Major Polyploidy Events Experienced by Brassicaceae Species.
(A) Scatterplot of all Gaussian mixture model parameters from Ks distributions of Brassicales species. The mean of the ln (Ks) value for each Gaussian component of the fitted model were plotted against their sd for each species (colored circles and squares). The diameter of each circle or square is proportional to data fraction (Supplemental Data Set 1). Four independent clusters (large gray circles) represent major meso- and paleopolyploidy events. A table representing cluster average, sd, and estimated age of associated polyploidy events is appended below the scatterplot.
(B) Age distributions of A. thaliana paralogs representing α, β, and γ paleopolyploidy events. Mixture models fitted to Gaussian components in the histograms of frequency distributions of Ks values obtained by comparing pairs of α, β, and γ duplicates (Bowers et al., 2003) are shown.

