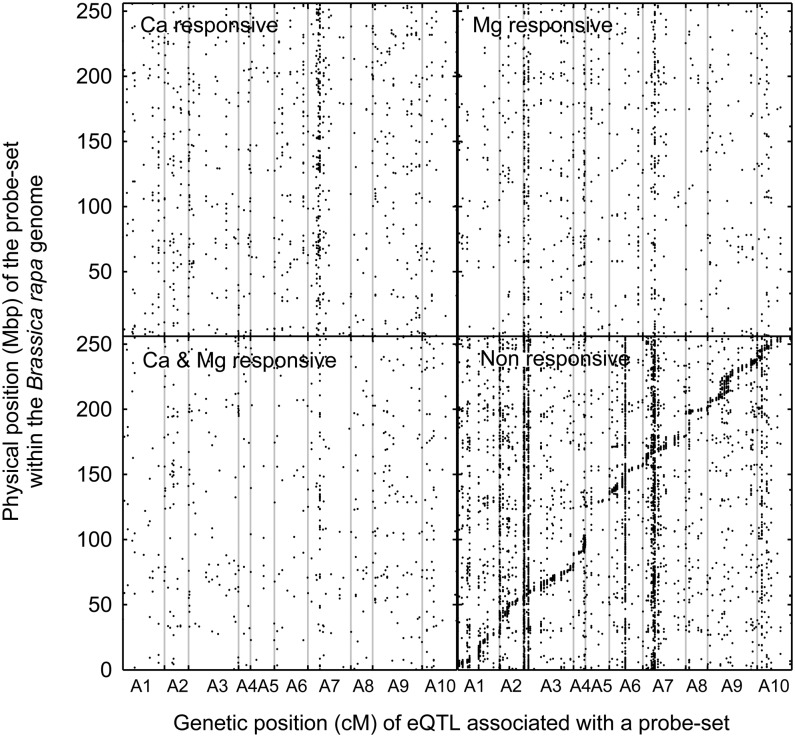
Figure 3.
Physical Positions of eQTLs as a Function of Genetic Position.
Data are shown from 85 lines of the B. rapa BraIRRI mapping population grown in compost under three treatments (LL, HL, and LH) as follows: the high concentrations were 24 mM CaCl2 and 15 mM MgCl2, and the low concentrations were 3 mM CaCl2 and 1 mM MgCl2. Each data point represents a unique eQTL (LOD score > 3.17) designated as responsive to Ca only, to Mg only, to Ca and Mg, or nonresponsive based on additive effects.

