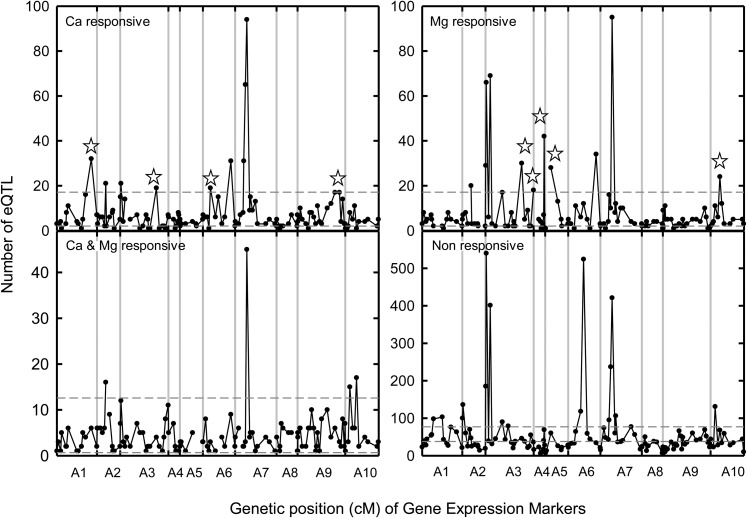
Figure 4.
Distribution of eQTLs Associated with Individual Markers (Black Circles).
Dashed horizontal lines represent the 99.0% upper and lower confidence intervals of the Poisson distribution, which assumes that GEMs and eQTLs are distributed equally across the genome. Data are shown from 85 lines of the B. rapa BraIRRI mapping population grown in compost under three treatments (LL, HL, and LH) as follows: the high concentrations were 24 mM CaCl2 and 15 mM MgCl2, and the low concentrations were 3 mM CaCl2 and 1 mM MgCl2. eQTLs were designated as responsive to Ca only, to Mg only, to Ca and Mg, or nonresponsive based on additive effects. Stars indicate eQTL hot spots discussed in the article.

