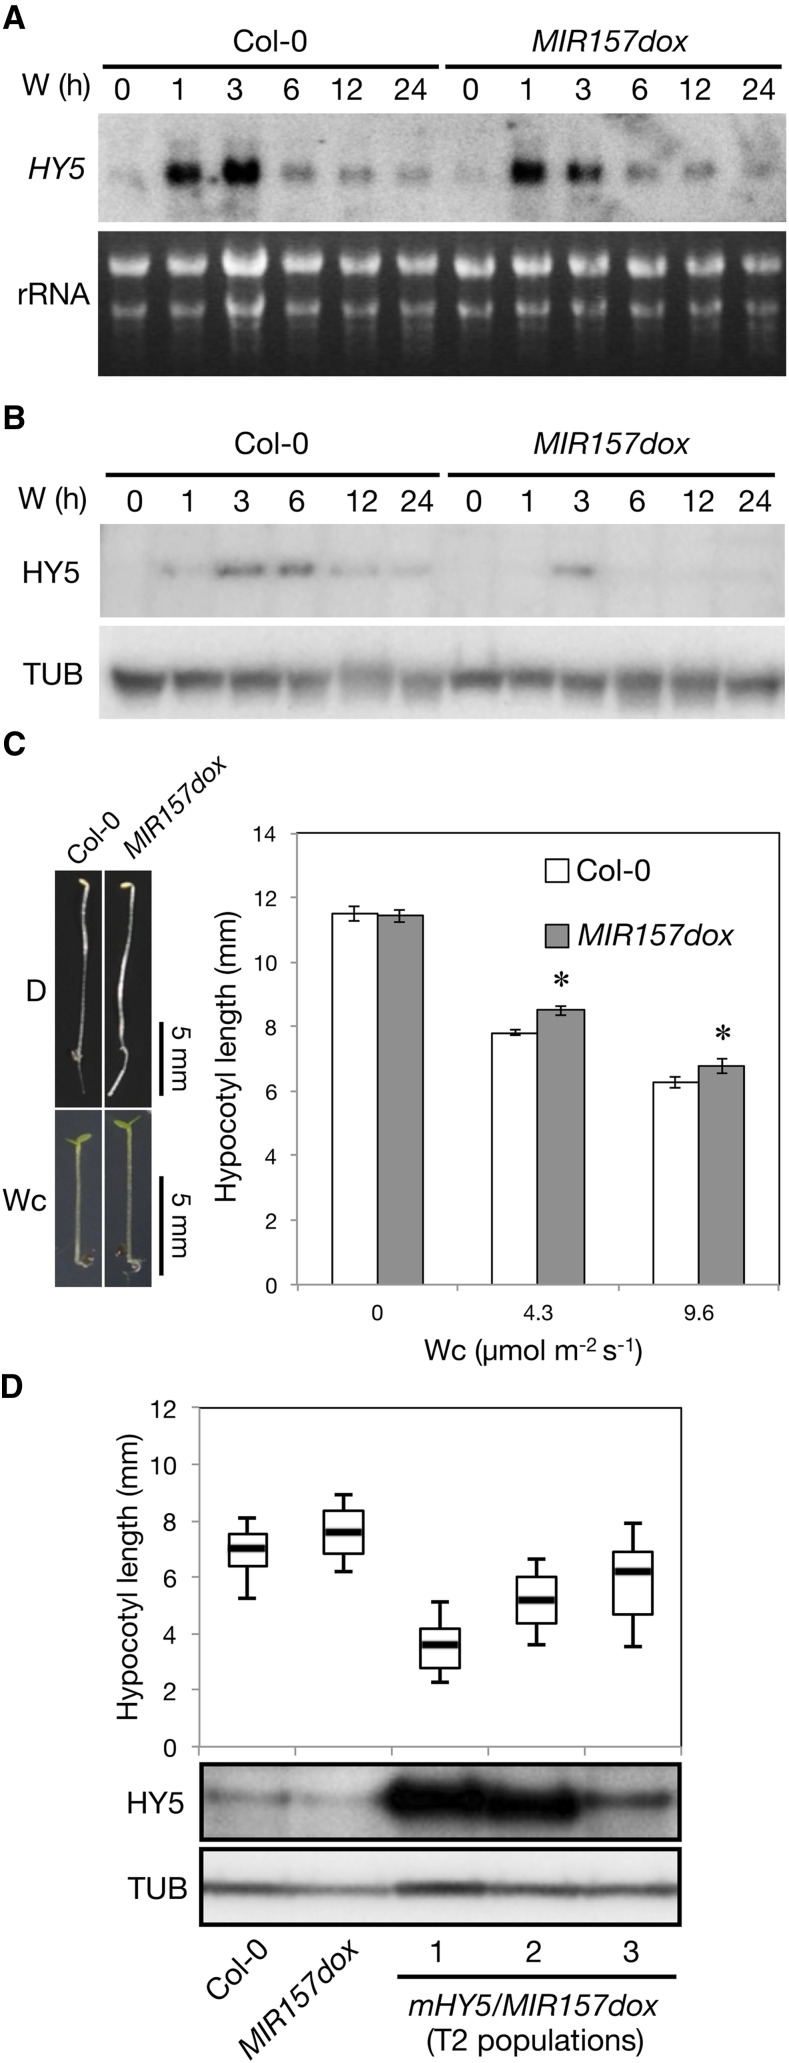
Figure 8.
The Effect of MIR157d Overexpression on Photomorphogenesis.
(A) RNA gel blot analysis of HY5 with 5 μg total RNA from 4-d-old etiolated Col-0 and MIR157dox seedlings exposed to W (50 μmol m−2 s−1) for the times indicated. The level of rRNA was a loading control. Numbers below the blot indicate HY5 level relative to the rRNA in each sample. One representative blot from three independent biological replicates is shown.
(B) Representative immunoblot analysis of HY5 in wild type (Col-0) and MIR157d overexpression line (MIR157dox) during photomorphogenesis with TUB as a loading control.
(C) Hypocotyl lengths of MIR157dox seedlings under Wc of indicated fluence rates. Data are mean ± se. *Significantly different from wild-type Arabidopsis (Col-0) (P < 0.01, Student’s t test; n = 13 to 15).
(D) Box plots (n = 65 to 98) show hypocotyl lengths of the wild type (Col-0), MIR157dox, and three independent mHY5/MIR157dox lines grown for 4 d under Wc (5 μmol m−2 s−1). The top, middle, and bottom of the box represent the 25, 50, and 75 percentiles, respectively, and the top and bottom black lines are the 10th and 90th percentiles, respectively. HY5 levels in etiolated seedlings exposed to Wc (50 μmol m−2 s−1) for 6 h were determined by immunoblot analysis with TUB as a loading control.
[See online article for color version of this figure.]

