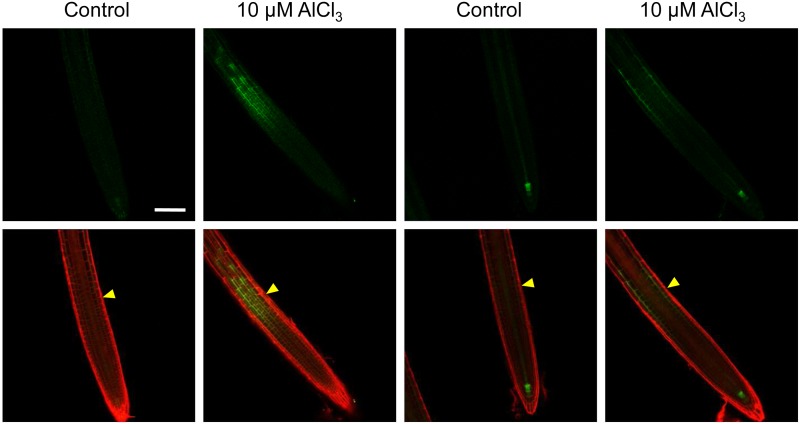
Figure 4.
Al Induces TAA1:GFP Expression in the TZ.
Six-day-old transgenic TAA1:GFP seedlings were exposed to either 0 (control) or 10 μM AlCl3 for 2 h. The two left columns show TAA1:GFP signals in the epidermis, and the two right columns show TAA1:GFP signals in the cortex. The top row shows the expression of TAA1:GFP, while the bottom row shows an overlay of the TAA1:GFP expression and PI staining (the latter used to highlight cell boundaries). The TZ is marked by yellow arrowheads. Bar = 100 μm.

