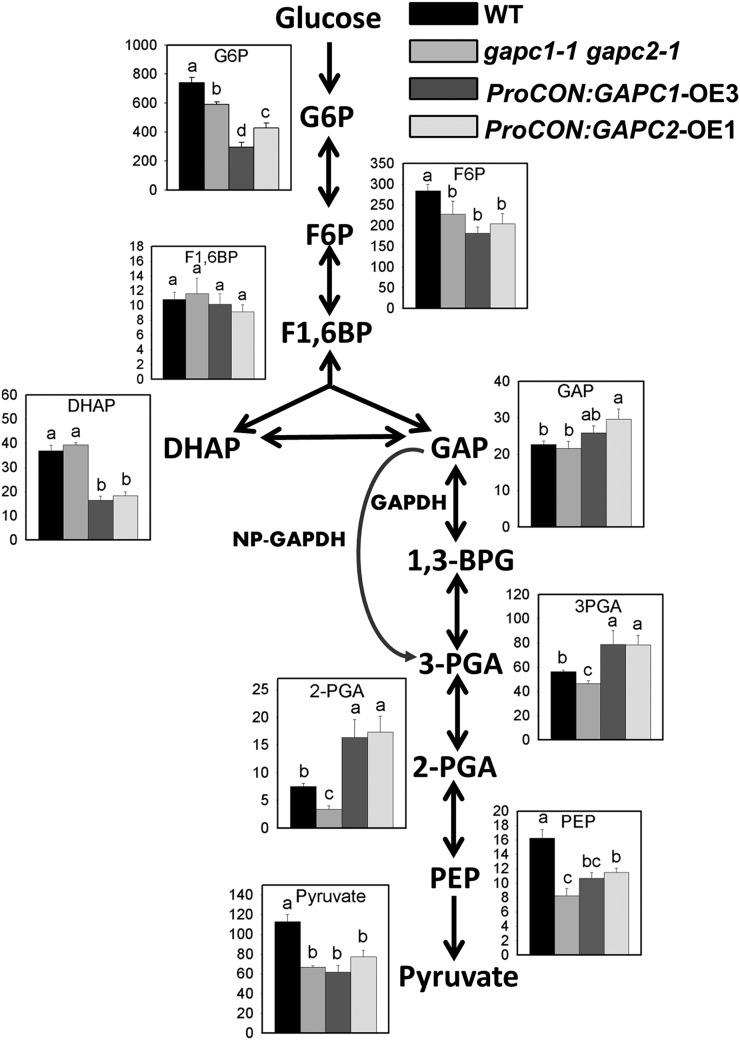
Figure 7.
Altered Metabolite Level in the Glycolysis Pathway in Developing Seeds of gapc1-1 gapc2-1 and Seed-Specific OEs.
Metabolites were extracted from T2 developing seeds (12 to 14 DAF) and determined and quantified by comparison with authentic standards. The y axis is metabolite content in nmol/g fresh weight (FW). 1,3-BPG was below the detection level and thus not measured. Values are means ± se (n = 4). One-way ANOVA was performed, and different lowercase letters mark significant differences among the wild type, gapc1-1 gapc2-1, and OEs (P < 0.05). G6P, glucose-6-phosphate; F6P, fructose-6-phosphate; F1,6BP, fructose-1,6-diphosphate; DHAP, dihydroxy-acetone-phosphate; 1,3-BPG, 1,3-bisphosphoglycerate; 3PGA, glycerate-3-phosphate; 2PGA, glycerate-2-phosphate.

