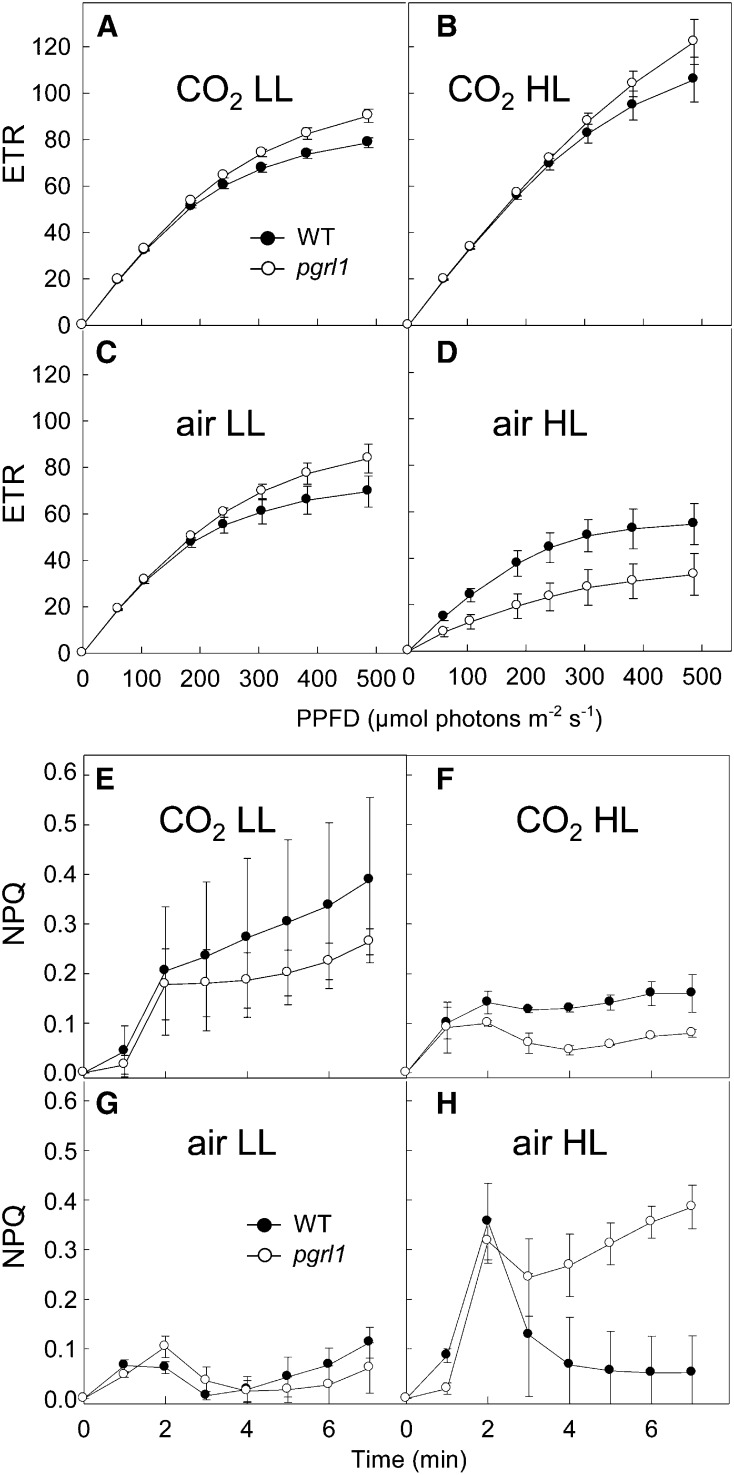
Figure 1.
ETR and NPQ Measured in Wild-Type and pgrl1 C. reinhardtii Lines Grown Photoautotrophically under Two Different Light Intensities and CO2 Concentrations.
ETR ([A] to [D]) and NPQ ([E] to [H]) were determined from pulse-modulated chlorophyll fluorescence measurements. Cells (2.5 × 10⁶ cells mL−1) were sampled during exponential growth of batch cultures. Cells were grown in LL ([A], [C], [E], and [G]) (50 μmol photons m−2 s−1), HL ([B], [D], [F], and [H]) (200 μmol photons m−2 s−1), 2% CO2-enriched air ([A], [B], [E], and [F]), and air ([C], [D], [G], and [H]). Wild-type progenitor line (closed circles); pgrl1 mutant (open circles). Shown are means ± sd (n = 3).

