Figure 1.
AFM Analysis of Grana Thylakoid Membranes Isolated from Spinach.
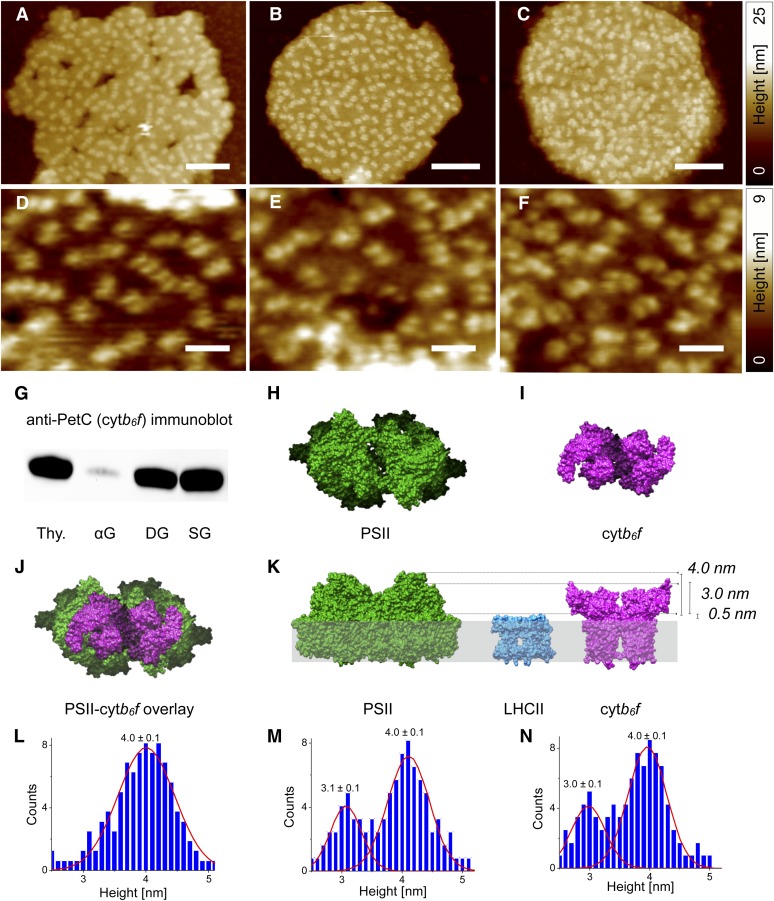
(A) to (F) AFM topographs of αG membranes ([A] and [D]), DG membranes ([B] and [E]), and SG membranes ([C] and [F]). Bars = 100 nm in (A) to (C) and 35 nm in (D) to (F).
(G) Immunoblot of the cytb6f (PetC) content of thylakoids and grana membrane preparations (thy. = intact thylakoids).
(H) to (J) Atomic models viewed from the thylakoid lumen membrane side of dimeric PSII (Protein Data Bank [PDB] code: 1S5L) (H), dimeric cytb6f (PDB code: 1UM3) (I), and overlay comparison (J).
(K) Atomic models of dimeric PSII, dimeric cytb6f, and trimeric LHCII (PDB code: 2BHW) viewed parallel to the thylakoid membrane. The dashed lines show the height difference between PSII and cytb6f of ∼1 nm and their heights above the LHCII complex, which protrudes by ∼0.5 nm from the luminal membrane surface.
(L) to (N) Histogram of maximum heights of protruding topological features above the surrounding area in αG (L), DG (M), and SG membranes (N).

