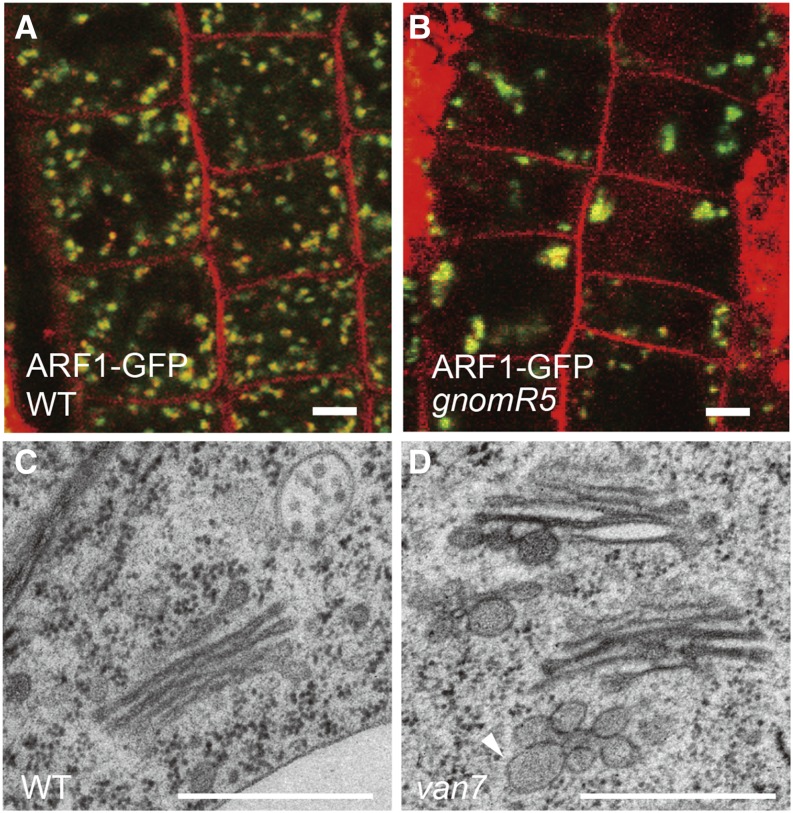
Figure 8.
Abnormal Morphology or Distribution of TGN/EE Is Observed in gnom Mutants.
(A) and (B) CLSM image of ARF1-GFP (green) and FM4-64 (red) signals in wild-type (A) and gnomR5 (B) root cells. ARF1-GFP-labeled structures are enlarged or aggregated in gnomR5 mutants (B).
(C) and (D) TEM image of wild-type (C) and van7 (D) root cells. TGN/EE with highly vesiculated profiles in van7 mutants (D). Arrowhead indicates vesiculated TGN/EE.
Bars = 4 μm for (A) and (B) and 500 nm for (C) and (D).

