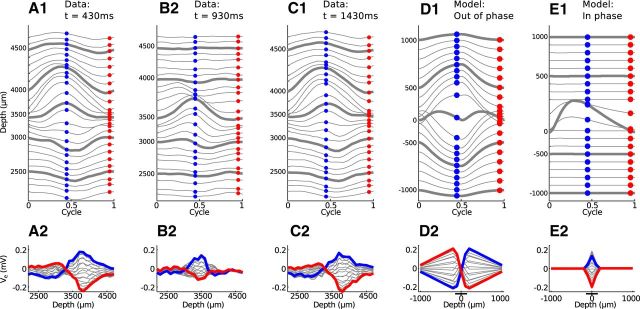
Figure 11.
Comparison of summed monaural neurophonic responses. Figure format is the same as in Figure 10. A–C, In vivo data are sum of response to 1200 Hz contralateral tone and 1201 Hz tone in ipsilateral ear. D, E, Simulations are sum of monolateral responses to 1200 and 1201 Hz input trains. Similarity between these figures and Figure 10 shows neurophonic responses to binaural stimuli resemble the sum of responses to corresponding monaural stimuli.

